A 69-year-old woman with a past medical history of squamous cell carcinoma of the tongue status post definitive concurrent chemotherapy and radiation 10 years prior, stage 1A breast cancer (invasive ductal carcinoma) status post left mastectomy on adjuvant hormonal therapy 2 years prior, vitamin B12 deficiency, congenital absence of the thyroid, hypertension, depression, degenerative disk disease, and gout presented with a fall, following six months of 30-pound weight gain, fatigue, and lower extremity weakness.
In the Emergency Department, the patient was noted to have low voltage QRS complexes on electrocardiogram without electrical alternans (Figure 1). Chest x-ray demonstrated an enlarged cardiac silhouette with a small right-sided pleural effusion but no pulmonary edema (Figure 2). Echocardiogram was performed revealing a moderate-sized posterior pericardial effusion measuring up to 1.6 cm and a small pericardial effusion anteriorly to the right ventricle (Figure 3). There was no tamponade physiology seen, as evidenced by several findings. The inferior vena cava measured 2.4 cm in diameter and decreased by greater than 50% with inspiration. Doppler assessment across the mitral and tricuspid valve revealed the respiratory inflow variation was 15% and 59%, respectively. Finally, there was no diastolic chamber collapse. Gated cardiac computed tomography angiography (CTA) demonstrated a circumferential pericardial effusion with simple fluid and no pericardial thickening or thoracic malignancy (Figure 4).
On physical examination, the patient appeared pale and her skin was coarse. She was overweight. Body temperature was 98.6 F°, pulse was 71 beats per minute, blood pressure was 122/73, respiratory rate was 14 breaths per minute, and oxygen saturation was 100% on room air. Cardiovascular examination revealed a normal S1 and S2, with no pericardial rub or murmurs. There was no jugular venous distention or pulsus paradoxus. Trace edema was present in the lower extremities.
Electrolytes and kidney function were normal. Complete blood cell count showed a hemoglobin of 11.5 g/dL (normal range: 11.5-15.5 g/dL) with a mean corpuscular volume (MCV) of 97.9 fL (normal range: 80.0-100.0 fL), white blood cell count of 6.5 k/uL (normal range: 3.70-11.00 k/uL), and platelet count of 271 K/uL (normal range: 150-400 k/uL). High sensitivity C-reactive protein was 2.6 mg/L (normal range: <1.0 mg/L) and erythrocyte sedimentation rate was 33 mm/hr (normal range: 0-20 mm/hr). Rheumatoid factor and antinuclear antibody (ANA) were negative. NT-proBNP was 194 pg/mL (normal range: <125 pg/mL). Thyroid-stimulating hormone (TSH) level was 102.6 uIU/mL (normal range: 0.400-5.500 uIU/mL), with free T4 of 0.54 pg/mL (normal range: 0.9-1.7 ng/dL) and free T3 of 1.1 ng/dL (normal range: 79-165 ng/dL).
Figure 1
Figure 1
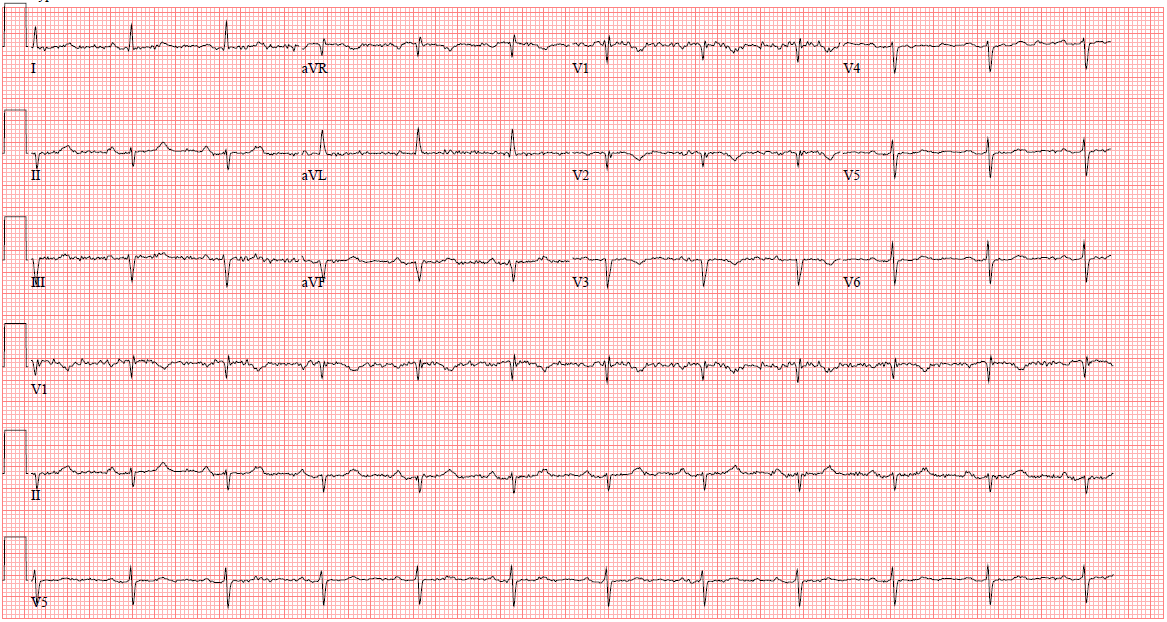
EKG showed low voltage QRS complexes.
EKG showed low voltage QRS complexes.
Figure 2
Figure 2
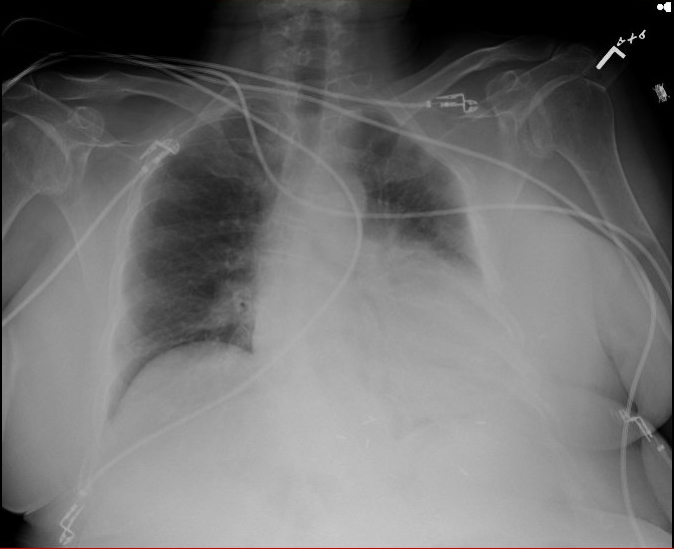
Chest x-ray showed an enlarged cardiac silhouette.
Chest x-ray showed an enlarged cardiac silhouette.
Figure 3
Figure 3
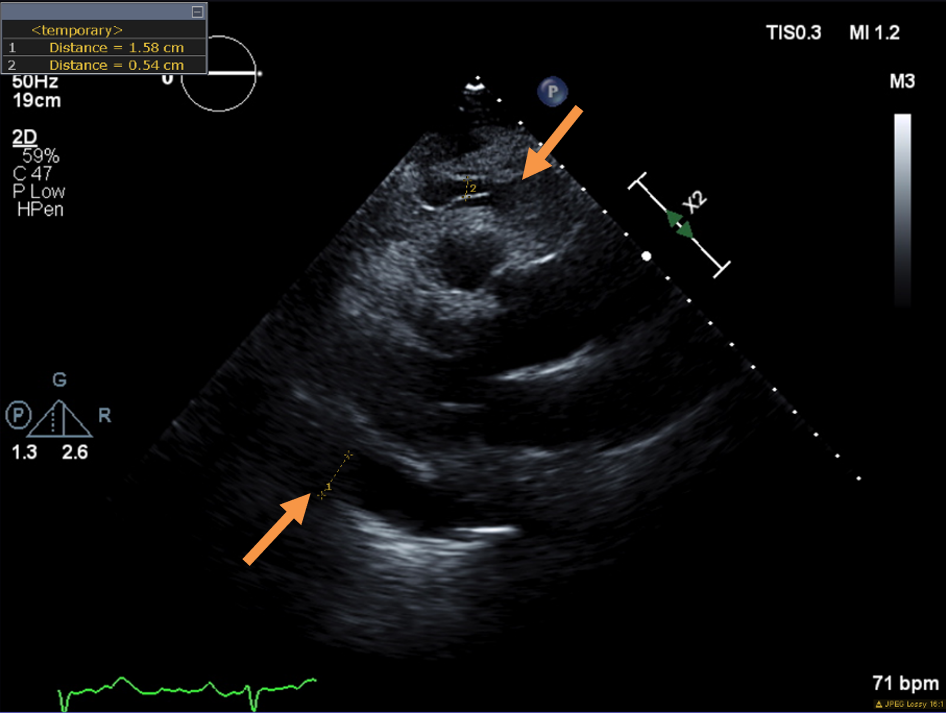
Parasternal long axis view demonstrating anterior (0.5 cm) and posterior (1.5 cm) pericardial effusion (arrows).
Parasternal long axis view demonstrating anterior (0.5 cm) and posterior (1.5 cm) pericardial effusion (arrows).
Figure 4
Figure 4
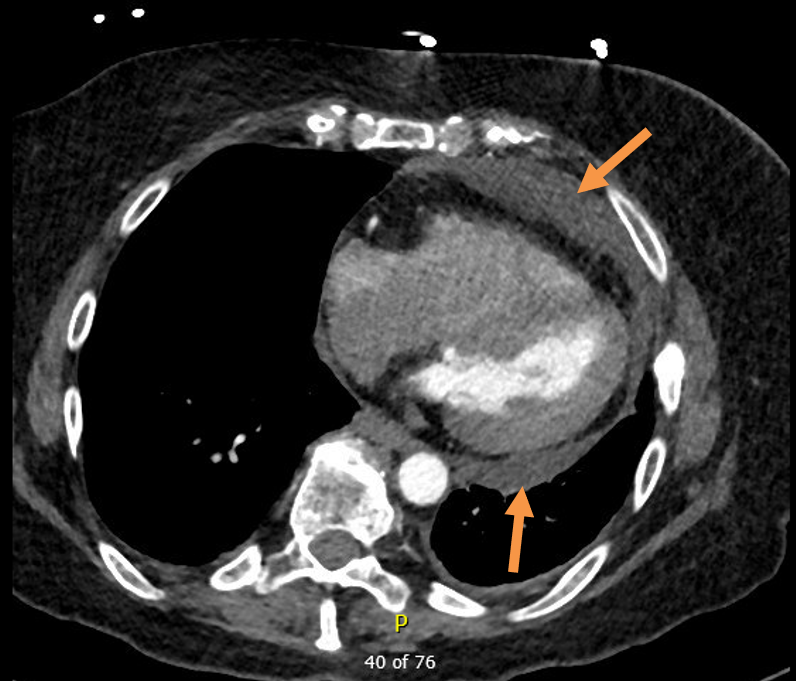
CTA chest (gated) with IV contrast demonstrated moderate pericardial effusion anteriorly and posteriorly (arrows).
CTA chest (gated) with IV contrast demonstrated moderate pericardial effusion anteriorly and posteriorly (arrows).
What is the most likely pathophysiology of this patient's pericardial effusion?
Show Answer
The correct answer is: A. Hypothyroidism resulting in increased capillary permeability and extravasation of protein and lipids into the pericardial space.
This patient presents with a pericardial effusion in the absence of pericarditis or tamponade. Investigations are notable for profound hypothyroidism with a significantly elevated TSH, suggesting under supplementation or nonadherence to thyroid medication. Echocardiogram and gated CTA chest shows this moderate-sized pericardial effusion is likely simple fluid and free-flowing in nature. Though this patient has a history of squamous and breast cancer, there are no signs of extrathoracic malignancy on CT chest. Furthermore, there is no pericardial thickening or nodularity to indicate metastatic involvement of the pericardium. These findings indicate that the most likely etiology of the patient's pericardial effusion is related to her state of hypothyroidism.
Hypothyroid-induced pericardial effusions are seen in one-third of cases of severe hypothyroidism, also known as myxedema coma, but can be observed in milder thyroid deficient states.1 The clinical presentation of hypothyroidism is characterized by generalized edema and the formation of exudates in multiple body cavities, including pericardial, pleural, and peritoneal spaces. The etiology of these phenomena are thought to be related to increased capillary permeability and decreased lymphatic drainage, resulting in the extravasation of proteins such albumin and glycosaminoglycans into the interstitium with associated water retention.2 Hypothyroidism is also associated with decreased lipid clearance, resulting in hyperlipidemia. Due to the aforementioned capillary permeability in hypothyroid states, leakage of cholesterol into the pericardial space can also occur. In 1919, J.S. Alexander described the golden tan pericardial fluid drained from a hypothyroid patient as "Gold Paint Effusion", which was due to presence of cholesterol crystals.3 Untreated, the accumulation of pericardial fluid in hypothyroid patients is slow, and as a result, patients rarely develop tamponade requiring pericardial drainage.4 Instead, thyroid supplementation is the mainstay of treatment, resulting in gradual resolution of the pericardial fluid over time, and can be monitored using transthoracic echocardiography.4
Cancer (Answer B) is linked to a wide range of pericardial pathologies, including effusion. There are several mechanisms by which malignancy alone can result in pericardial effusion.5 The most frequent is hematogenous metastasis caused by primary tumors such as lung and breast cancer. An additional mechanism is direct contiguous invasion which arises in the setting of esophageal and pulmonary malignancies. Lastly, retrograde lymphatic extension can occur whereby the lymphatic drainage of the visceral pericardium is obstructed by the neoplasm in the mediastinum, resulting in the development of a pericardial effusion. Further imaging beyond echocardiography, such as CT or MRI, may evoke the diagnosis of a malignant pericardial effusion by demonstrating evidence of tumor in other organs. Moreover, the presence of metastatic spread to the pericardium in particular may be suggested by increased thickness or nodularity.6 Diagnosis is confirmed by cytologic analysis of pericardial fluid demonstrating neoplastic cells, with a sensitivity of approximately 92%.7
Patients with malignancy may also develop pericardial effusion related to their oncologic treatments, specifically chemotherapy and radiation (Answer C). Radiation-induced injury to the pericardium involves microvascular damage, with subsequent production of an exudative fluid.8 A concomitant inflammatory reaction in response to radiation can result in acute pericarditis. Risk factors for radiation-induced pericardial disease include anterior or left-sided chest radiation, a high cumulative dose of radiation, and inadequate shielding at the time of radiation therapy. Over the long term, other pericardial pathologies may develop, and these include delayed chronic pericardial effusion and constrictive pericarditis.9 This patient received radiation therapy as part of the treatment for her squamous cell cancer of the tongue, not as part of her breast cancer. While radiation therapy for breast cancer can cause pericardial complications, radiation to the head and neck region is not associated with pericardial injury, likely due to its extrathoracic location.
Post-infectious viral pericarditis (Answer D) is often preceded by "flu-like" upper respiratory tract symptoms, and can be accompanied by fever and chest pain. A pericardial effusion may or may not present. Electrocardiogram characteristically demonstrates diffuse ST elevation due inflammation of the epicardium. In this patient, there is an absence of the above symptoms and electrocardiographic features, and as a result, viral pericarditis is unlikely to be the cause of her pericardial effusion.
References
Dattilo G, Crosca S, Tavella S, Marte F, Patane S. Pericardial effusion associated with subclinical hypothyroidism. Int J Cardiol. 2011;153:e47-50.
Parving HH, Hansen JM, Nielsen SL, Rossing N, Munck O, Lassen NA. Mechanisms of edema formation in myxedema--increased protein extravasation and relatively slow lymphatic drainage. N Engl J Med. 1979;301:460-5.
Alexander JS. A pericardial effusion of "gold-paint" appearance due to presence of cholesterin. Br Med J. 1919;2:463.
Kerber RE, Sherman B. Echocardiographic evaluation of pericardial effusion in myxedema. Incidence and biochemical and clinical correlations. Circulation. 1975;52:823-7.
Schusler R, Meyerson SL. Pericardial Disease Associated with Malignancy. Curr Cardiol Rep. 2018;20:92.
Refaat MM, Katz WE. Neoplastic pericardial effusion. Clin Cardiol. 2011;34:593-8.
Saab J, Hoda RS, Narula N, et al. Diagnostic yield of cytopathology in evaluating pericardial effusions: Clinicopathologic analysis of 419 specimens. Cancer Cytopathol. 2017;125:128-37.
Yusuf SW, Sami S, Daher IN. Radiation-induced heart disease: A clinical update. Cardiol Res Pract. 2011;317659.
Taunk NK, Haffty BG, Kostis JB, Goyal S. Radiation-induced heart disease: pathologic abnormalities and putative mechanisms. Front Oncol. 2015;5:39.
Chahine J, Ala CK, Gentry JL, Pantalone KM, Klein AL. Pericardial diseases in patients with hypothyroidism. Heart 2019;105:1027-33.