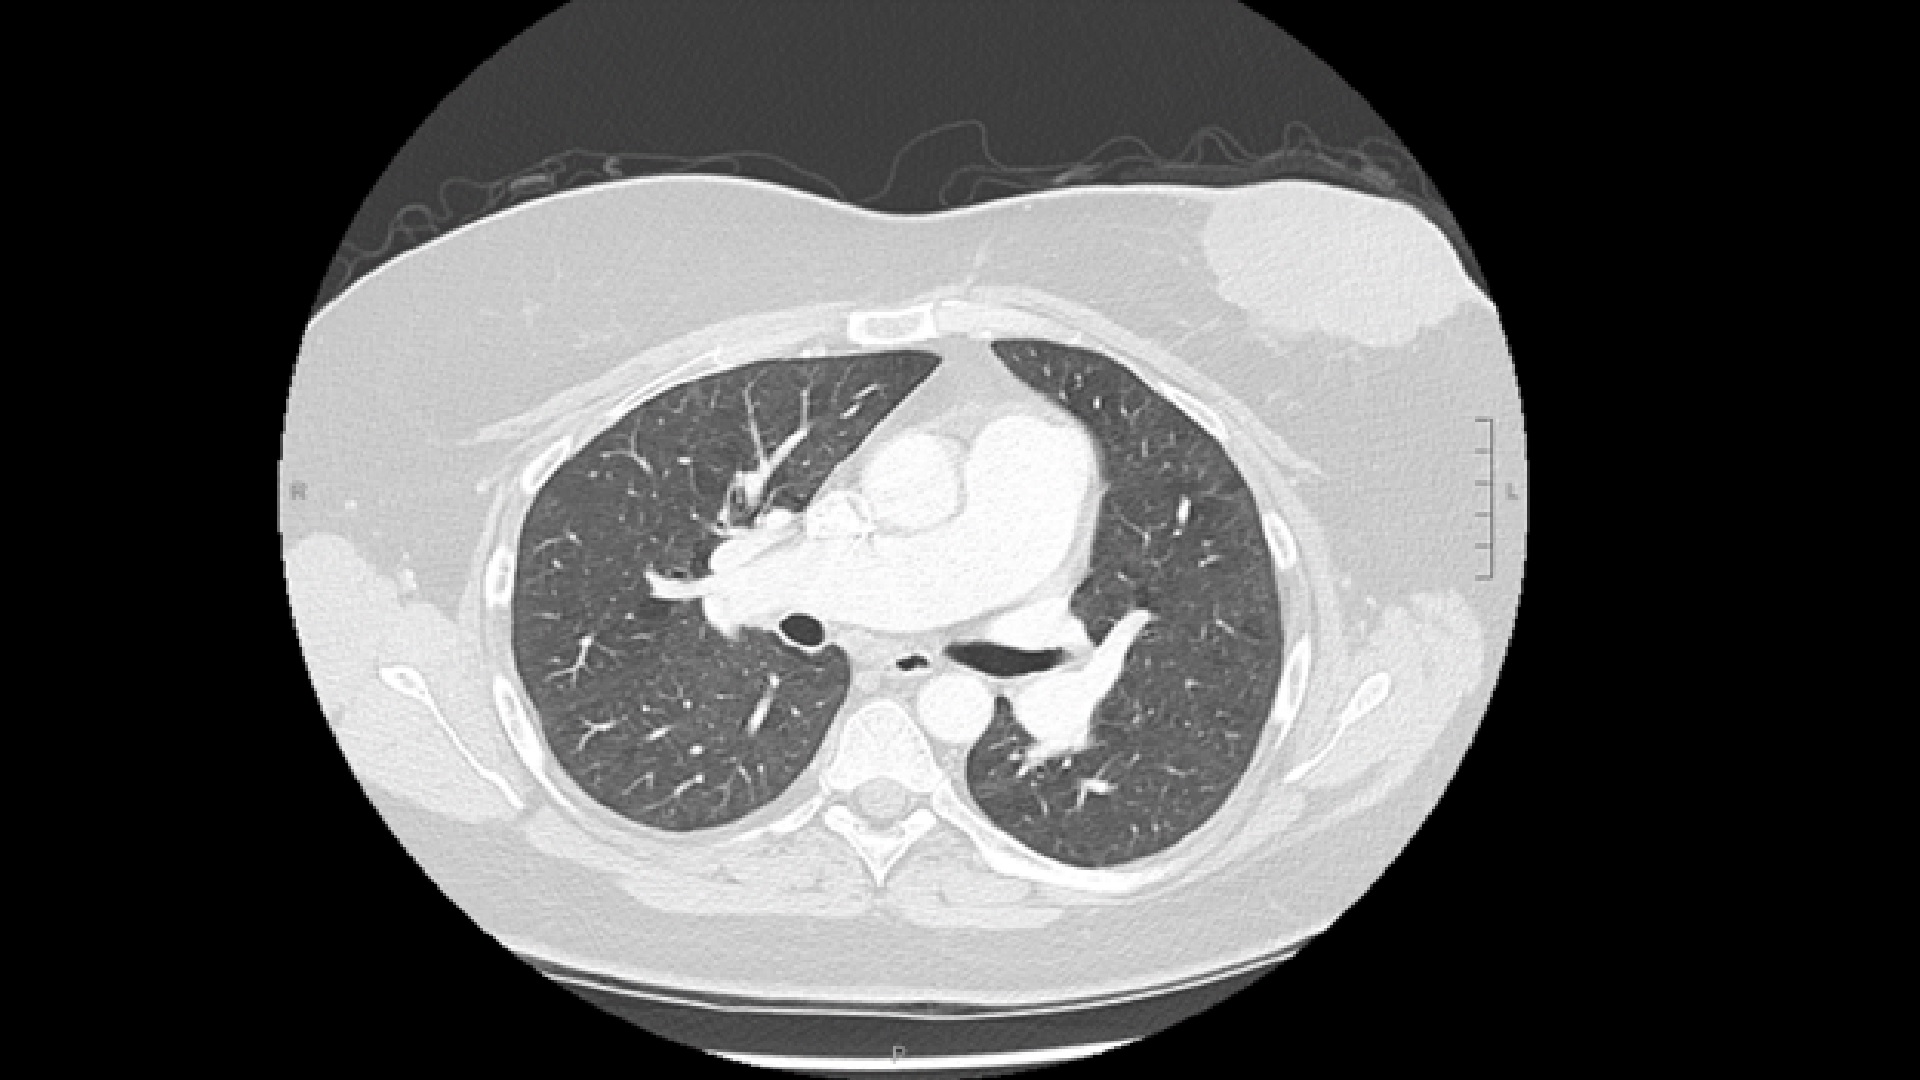
A 55-year-old post-menopausal Caucasian woman with a medical history significant for controlled hypertension and a left breast cyst was referred to an oncologist for a 2-year history of an expanding left breast mass associated with bleeding and dermal changes. She was diagnosed with ER+, PR+, HER-2- left-sided locally advanced invasive ductal carcinoma. During initial investigations, staging computed tomography (CT) demonstrated an enlarged main pulmonary artery (PA) and right and left branches. A mosaic attenuation pattern throughout both lungs suggested pulmonary arterial hypertension (Figure 1). A cardiology referral and echocardiogram were requested for further assessment.
Figure 1: Chest CT With Contrast Showing Mosaic Attenuation of the Bilateral Lung Fields and Enlargement of the Main PA and Right PA
Figure 1
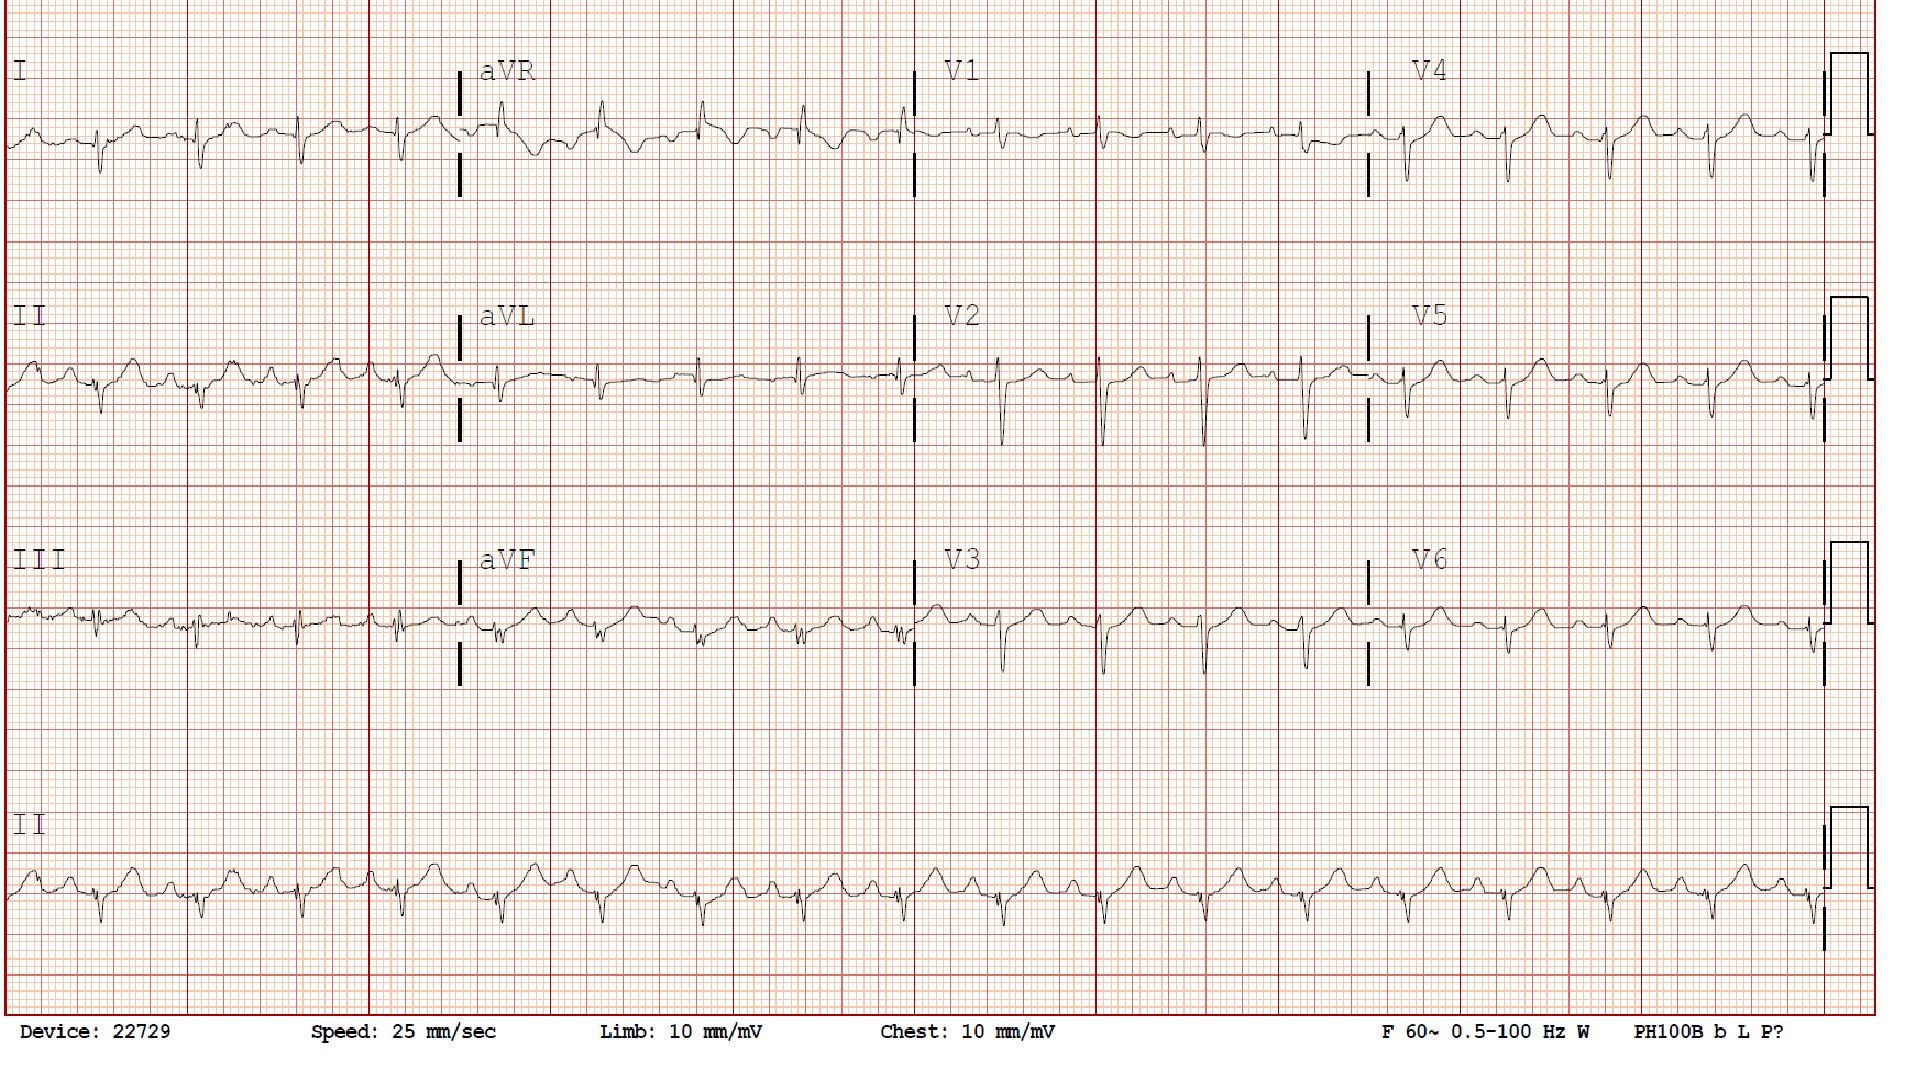
Clinically, she had no symptoms of angina or dyspnea and had a good exercise tolerance. She had no previous history of deep vein thromboses or pulmonary emboli. Physical examination showed a blood pressure of 137/87 with a regular heart rate of 91 bpm. Adventitious sounds were heard to both bases. The jugular venous pressure was not elevated. S1 and S2 were normal. There was a grade 1/6 systolic crescendo decrescendo systolic murmur over the second left intercostal space. An electrocardiogram showed sinus rhythm with right axis deviation (Figure 2). Her echocardiogram showed a dilated right ventricle (RV) (Video 1) with normal function. There was insufficient tricuspid regurgitation (TR) to estimate right ventricular systolic pressure (RVSP) (Figure 3), but the septum was abnormally "D-shaped" (Video 2). A saline bubble study was positive for an interatrial shunt (Video 3). Pulmonary function testing and a sleep study revealed only mild restrictive lung disease and mild sleep apnea, respectively.
Figure 2: Electrocardiogram Showing Sinus Tachycardia at 108 bpm With Right Axis Deviation
Figure 2
Video 1
Transthoracic echocardiogram (TTE) in apical four-chamber view showing a dilated RV compared with the left ventricle (LV). The basal RV:LV end-diastolic diameter ratio was abnormal: >2/3.
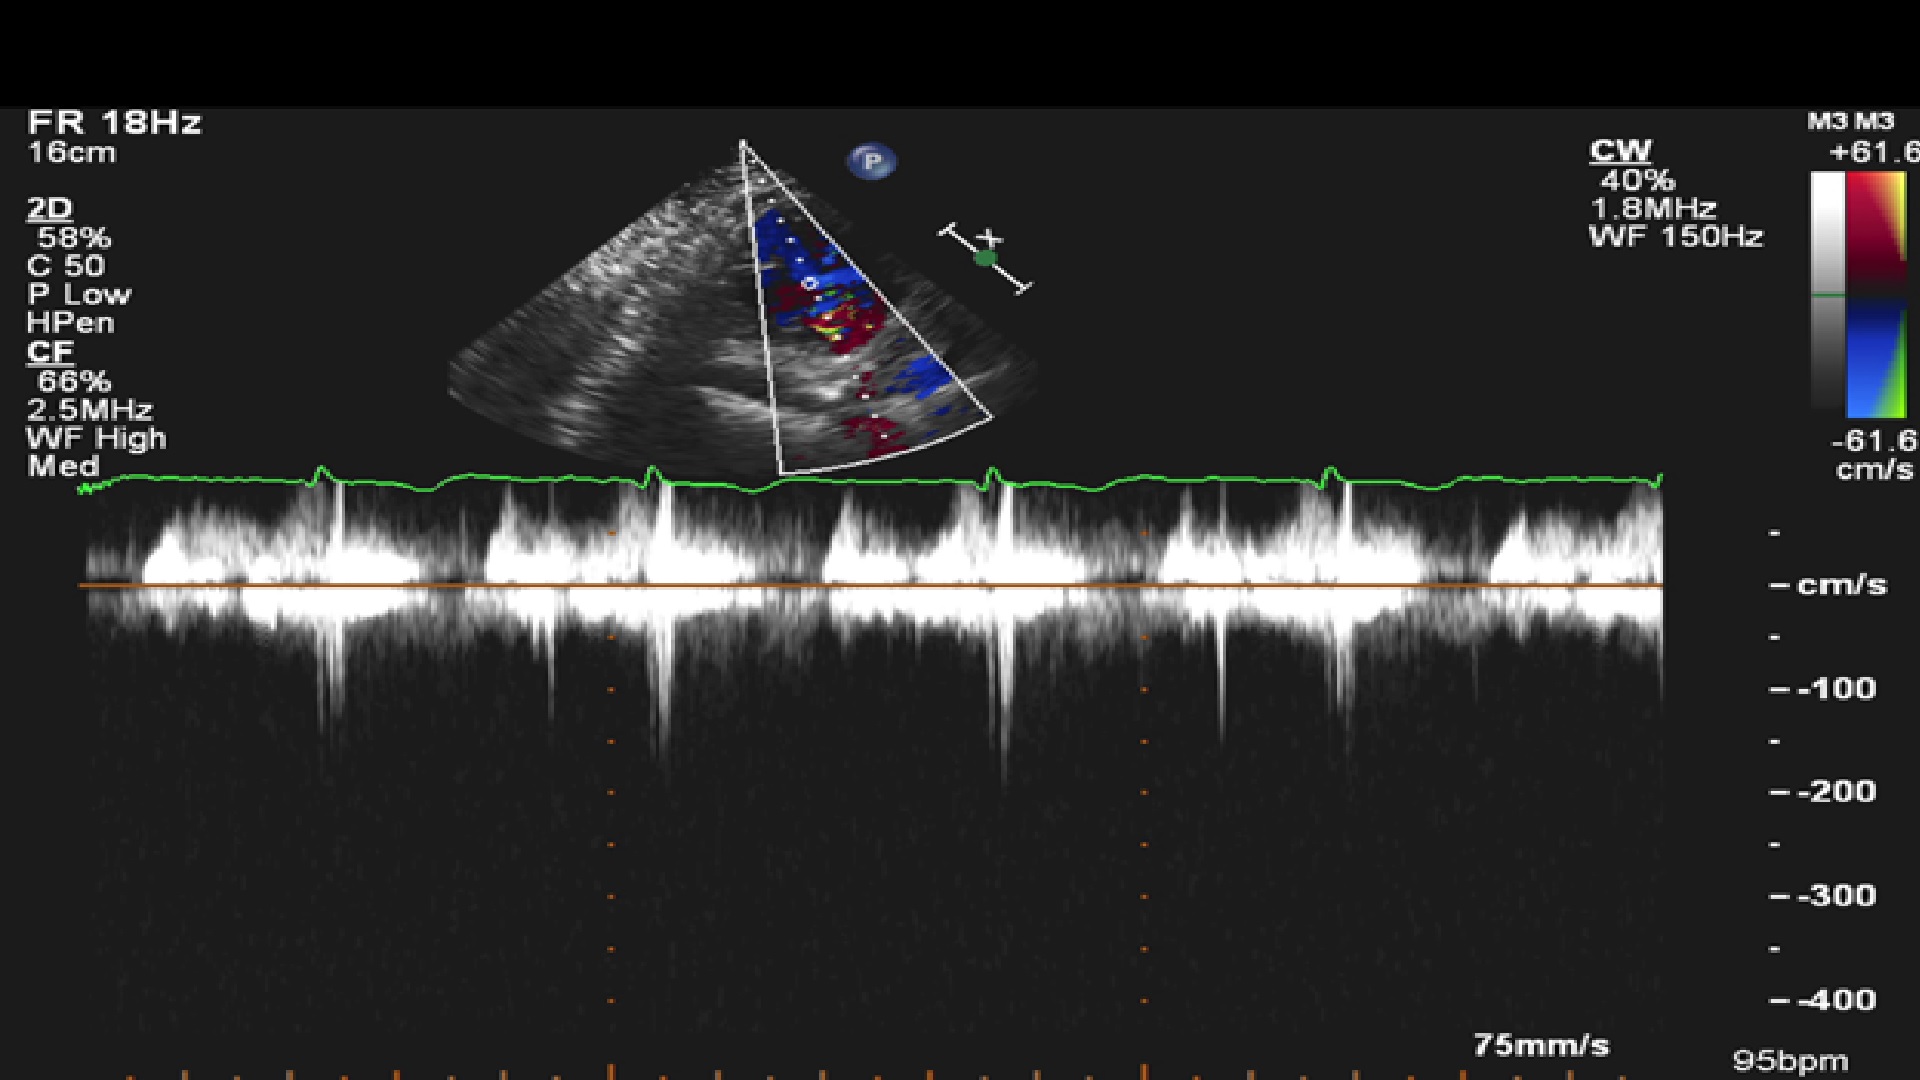
Figure 3
Figure 3
Continuous wave Doppler through the tricuspid valve in parasternal long axis. Insufficient TR waveform to calculate RVSP.
Continuous wave Doppler through the tricuspid valve in parasternal long axis. Insufficient TR waveform to calculate RVSP.
Video 2
TTE in parasternal short axis at the level of the papillary muscles showing a flatted D-shaped septum, denoting RV volume overload and some RV pressure overload.
Video 3
TTE showing a positive saline bubble study with Valsalva, i.e., bubbles crossing the interatrial septum.
Which of these statements is TRUE?
Show Answer
The correct answer is: B. An abnormal basal RV:LV end-diastolic diameter ratio of >0.67 on the apical four-chamber echocardiography is independently associated with PH but is of lower diagnostic value than the TR velocity.
When a TR velocity signal is uninterpretable and precludes RVSP estimation, other measures of RV structure or function such as end-diastolic basal RV/LV diameter ratio (>0.67, measured in the apical four-chamber view) and LV systolic eccentricity index (>1.2, measured in the short-axis view) are helpful to discriminate PH but are of lower diagnostic value than the TR velocity.1 In the absence of TR, mean pulmonary pressures can be estimated if pulmonary regurgitation is present or by measuring a pulsed Doppler of the PA in systole.2
The absence of a TR jet does not indicate normal pulmonary pressures. Signs of elevated RVSP may still be present (e.g., flattened or D-shaped septum, as in this case, or dilated non-collapsing inferior vena cava). Alternative diagnostic approaches, such as right-sided cardiac catheterization, should be considered. The limitations of echocardiography in the evaluation of PA pressures are due to poor ultrasound tissue penetration and the ability to obtain a parallel intercept angle between the ultrasound beam and the tricuspid regurgitant jet.3 Weak signals can be enhanced with saline contrast (agitated or mixed with blood) with careful attention to not overestimate the spectral envelope.2
The modified Bernoulli's equation calculates pressure using Doppler velocities. In the presence of anemia, this simplified formula overestimates calculated pressure gradients such as RVSP derived using the TR velocity.2
A right-heart catheterization revealed the following right-sided heart pressures:
Right atrium = 7 mmHg
RV = 40 mmHg / 8 mmHg
PA = 40 mmHg / 15 mmHg (mean 25 mmHg)
Mean wedge = 8 mmHg
Venocaval oxygen saturation was 76% with a step up of oxygen saturation to the PA of 86%. The arterial saturation was 96%, and the left-to-right shunt was calculated at 1.7:1. A transesophageal echocardiogram confirmed a superior vena cava type sinus venosus defect and partial anomalous return of the right upper pulmonary vein, resulting in predominantly left-to-right shunt at the atrial level (Video 4). The pulmonary to systemic flow (Qp:Qs) was 1.8:1. The echocardiographic findings were also confirmed by cardiac magnetic resonance imaging.
Video 4
Transesophageal echocardiogram showing a sinus venosus defect with colour flow crossing the interatrial septum.
The assessment for increased pulmonary pressures by echocardiography is important in cardio-oncology because the etiology of PH may be due to a primary malignancy or the result of treatment regimens. Case reports have linked hematological malignancies such as multiple myeloma and intravascular lymphoma to PH, although it is not commonly recognized.4,5 Solid tumour and hematological malignancies have also been linked to extrinsic compression of the PAs or recurrent thromboembolic events.6 Cancer treatments such as chemotherapy (with alkylating agents, alkaloids, and antimetabolites), radiotherapy, and bone marrow transplantation have also been associated with severe pulmonary veno-occlusive disease, a rare subtype of PH.7 This case highlights the importance of recognizing signs of PH by echocardiography and assessing for further etiologies of this condition.
References
Amsallem M, Sternbach JM, Adigopula S, et al. Addressing the Controversy of Estimating Pulmonary Arterial Pressure by Echocardiography. J Am Soc Echocardiogr 2016;29:93-102.
Rudski LG, Lai WW, Afilalo J, et al. Guidelines for the echocardiographic assessment of the right heart in adults: a report from the American Society of Echocardiography endorsed by the European Association of Echocardiography, a registered branch of the European Society of Cardiology, and the Canadian Society of Echocardiography. J Am Soc Echocardiogr 2010;23:685-713.
Otto CM. Textbook of Clinical Echocardiography. 5th ed. Philadelphia: Elsevier Saunders; 2013.
Krishnan U, Mark TM, Niesvizky R, Sobol I. Pulmonary hypertension complicating multiple myeloma. Pulm Circ 2015;5:590-7.
Aouba A, Diop S, Saadoun D, et al. Severe pulmonary arterial hypertension as initial manifestation of intravascular lymphoma: case report. Am J Hematol 2005;79:46-9.
Lee AY, Levine MN. Venous thromboembolism and cancer: risks and outcomes. Circulation 2003;107(23 Suppl 1):I17-21.
Ballout FA, Manshad AS, Okwuosa TM. Pulmonary Hypertension and Cancer: Etiology, Diagnosis, and Management. Curr Treat Options Cardiovasc Med 2017;19:44.