A 55-year-old Caucasian woman with a history of ulcerative colitis (diagnosed at the age of 24) with no known cardiovascular risk factors was seen in the emergency department after a 1-week history of sharp, right-sided chest pain. The chest pain was atypical, non-exertional and lasted approximately 1 hour at a time. Over the past month, she had been intermittently febrile with occasional night sweats and non-bloody, non-mucoid diarrhea. Review of systems was notable for ongoing chills, fatigue, headache, and weakness but no nausea, abdominal pain, rash, dyspnea, or sick contacts. She had no history of drug, tobacco, or alcohol use.
She was hospitalized 4 months prior during a trip to China for severe nausea, emesis, and diarrhea. She required antibiotics and intravenous hydration. Her last flare of ulcerative colitis was 6 months prior, at which time she was already maintained on mesalamine but was treated successfully with a course of prednisone.
Her blood pressure was 100/58 mmHg, heart rate was 90 bpm, respiratory rate was 18, temperature was 101°F, and O2 saturation was 98% on room air. Her cardiovascular exam and remainder of the physical exam was unremarkable.
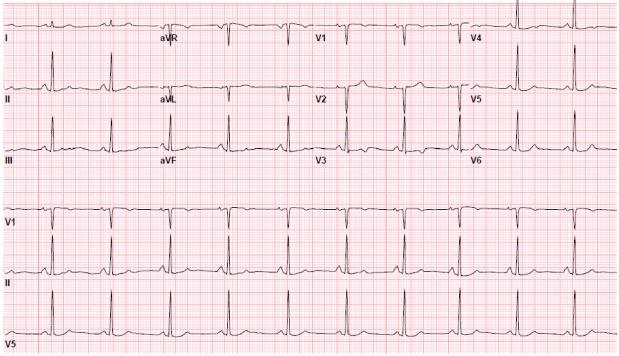
The electrocardiogram showed normal sinus rhythm with mild T-wave abnormalities in the anterior leads (Figure 1). The chest X-ray demonstrated no acute processes. Initial laboratory studies revealed a normal basic chemistry, mild transaminitis (aspartate aminotransferase = 43 U/L; alanine aminotransferase = 47 U/L; alkaline phosphatase = 126 U/L), elevated lipase = 721 U/L), and total white blood cell count of 10.7 with 24% eosinophils. The remainder of the complete blood count and coagulation studies were normal. The troponin was elevated at 0.3 ng/mL. The erythrocyte sedimentation rate was 36 mm/h, and C-reactive protein was 1.6 mg/L.
Figure 1: 12-Lead Electrocardiogram With Mild Anterior T-wave Abnormalities
Transthoracic echocardiogram showed normal left ventricle (LV) size and function (ejection fraction = 65%) with mildly increased wall thickness and mild diastolic dysfunction. Right ventricle (RV) size and function were normal. There was no significant valvular disease. An exercise stress echocardiogram during the hospitalization showed no regional wall motion abnormalities but possible apical hypertrophy without evidence of an LV outflow tract gradient.
Computed tomography (CT) of the abdomen and pelvis showed concentric wall thickening and edema suggestive of colitis in the descending colon, sigmoid colon, and rectum. A colonoscopy showed pseudomembranes. Magnetic resonance cholangiopancreatography showed small strictures of the right and left hepatic ducts, suspicious for early sclerosing cholangitis, and mural thickening and mucosal enhancement of the distal descending colon compatible with a diagnosis of ulcerative colitis. She was started on ursodiol and prednisone.
Her blood cultures were negative. Rheumatologic studies (anti-nuclear antibodies, anti-double stranded DNA, anti-neutrophil cytoplasmic antibodies) were normal, and Lyme testing was negative. Stool and antigen testing for C. difficile, ova/parasites, and Giardia were negative. Her chest pain resolved during the admission, and she was discharged.
In the outpatient setting, she saw a cardiologist in consultation. Her gastrointestinal symptoms had completely resolved. However, since being seen in the emergency department, she developed dyspnea, and the episodes of atypical chest pain recurred. Coronary CT angiography (CCTA) was ordered for anatomical assessment of coronary arteries.
The CCTA showed normal coronary origins and minimal non-obstructive coronary artery disease (Figure 2). Thickening of the LV and RV apices was noted again, with hypoperfusion of the central portion of the thickening suggestive of thrombus (Figure 3).
Figure 2
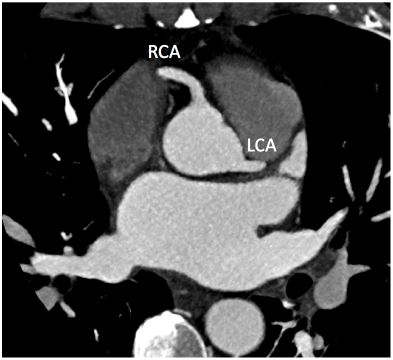 Axial CCTA showing normal coronary origins of the right coronary artery and left coronary artery. There was mild non-obstructive disease noted in the mid-left anterior descending artery and posterior descending artery (not seen here).
Figure 3
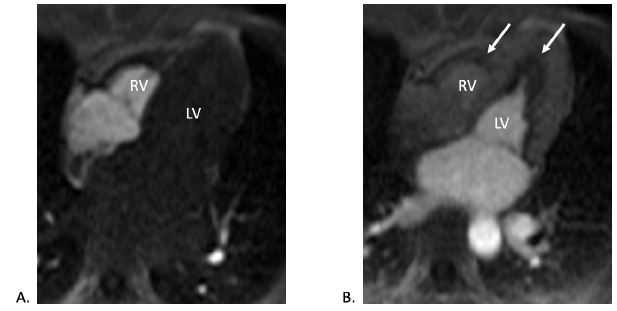
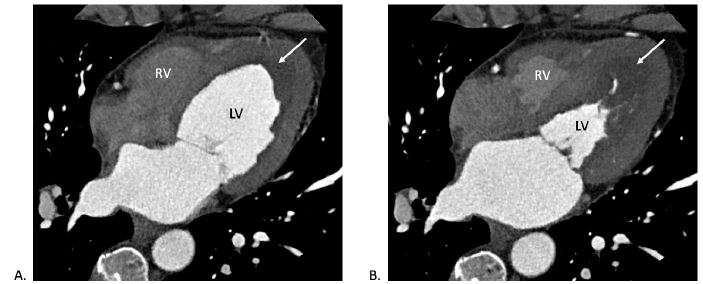 CT (four-chamber view) during (A) diastole and (B) systole showing LV and RV wall thickening with central hypoperfusion (white arrow) suggesting thrombus.
The correct answer is: B. Cardiac magnetic resonance (CMR) imaging
CMR imaging was completed. This showed normal biventricular size and systolic function with extensive biventricular apical thickening (Figures 4-5). Thickening of both mitral and tricuspid valve leaflets was also noted. Contrast administration revealed lack of subendocardial perfusion particular at the LV apex (Figure 6). On delayed enhancement imaging, the presence of an LV apical thrombus was confirmed, and there was diffuse enhancement of the subendocardium consistent with endocardial fibrosis (Figure 7). Collectively, the CMR findings suggested eosinophilic myocarditis.
Figure 4
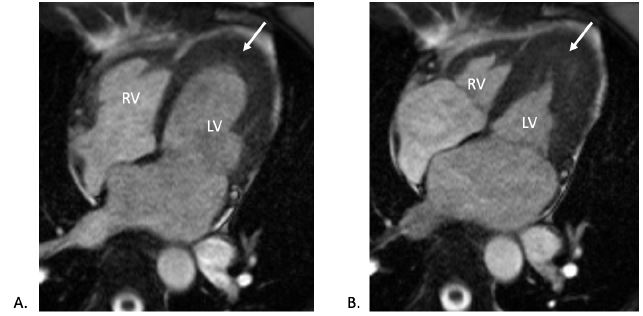 CMR (pre-contrast cine four-chamber view) during (A) diastole and (B) systole showing biventricular wall thickening in the apex (white arrows).
Figure 5
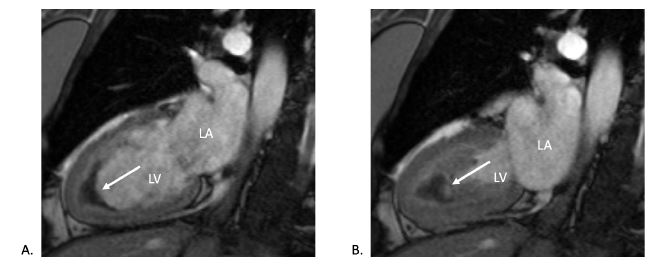 CMR (post-contrast cine two-chamber view) during (A) diastole and (B) systole showing biventricular wall thickening in the apex and hypo-intense apex suggesting apical thrombus (white arrows).
Figure 6
 CMR (four-chamber view) contrast perfusion imaging in both (A) early and (B) late phases showing endocardial hypoperfusion (white arrows), particularly in the apex.
Figure 7
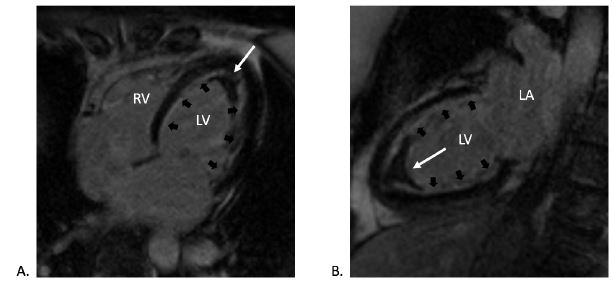 CMR late gadolinium enhancement imaging in (A) four-chamber and (B) two-chamber views confirming the presence of apical thrombus (white arrows) and highlighting the extensive subendocardial fibrosis (black arrows).
The patient had no cardiac risk factors and underwent two excellent diagnostic tests (CCTA and stress echocardiography) that excluded obstructive coronary artery disease or significant ischemia. Therefore, cardiac catheterization and exercise stress single-photon emission CT are not appropriate. Given the abnormal echocardiographic and CCTA findings in the LV and RV apices, the principal diagnostic dilemma was to distinguish an eosinophilic myocarditis from apical hypertrophic cardiomyopathy. This is best answered with CMR, which is considered the noninvasive standard for assessing myocarditis.1 Positron emission tomography imaging has been used as an adjunct to CMR to assess active inflammation,2 but it may not detect endocardial fibrosis or differentiate between apical thrombus and hypertrophic cardiomyopathy. An endomyocardial biopsy is the gold standard and only definitive test to diagnose eosinophilic myocarditis. However, an invasive approach was imprudent in our case due to the risk of emboli if thrombi were present, or simply if this represented hypertrophic cardiomyopathy. In hemodynamically stable patients, endomyocardial biopsy has a Class IIa indication.3
Eosinophilic myocarditis is a rare myocardial inflammatory process characterized histopathologically by tissue infiltration of eosinophils. Although eosinophilia is defined by a blood count greater than 1500 cells/mm3, 25% of patients do not have peripheral eosinophilia.4 Myocardial eosinophilic involvement has several stages, beginning as acute necrosis, followed by thrombosis and, finally, fibrosis of the myocardium and often valvular components as well.5
The World Health Organization classifies eosinophilic disorders into six broad categories.3 The most common etiology is a reactive eosinophilia or associated hypereosinophilic syndrome (HES); this includes hypersensitivity (drug induced, allergy, IgG4 disease), infectious (parasites, fungal), rheumatologic (polyangiitis, systemic lupus erythematosus, Churg-Strauss), and hematologic (in association with other lymphomas and leukemias) etiologies. Myeloproliferative HES is a clonal disorder of dysplastic eosinophils (FIP1L1-PDGRFA rearrangements). Lymphocytic variant HES is a clonal or aberrant lymphocyte population that secretes cytokines that drives eosinophilia.6 Overlap HES demonstrates involvement of multiple organ systems. Familial HES is a rare autosomal dominant disorder. If the workup for all of the above is negative, the diagnosis is idiopathic HES.
Despite different underlying causes for eosinophilia, the consequences of eosinophilic myocarditis may be identical. The clinical presentation is highly variable in acuity, severity, and risk of progression. Fulminant or acute necrotizing eosinophilic myocarditis can often lead to cardiogenic shock and sudden death, with multiple case series of mechanical circulatory support use. In addition, untreated HES has an average survival of 9 months.1 The clinical diagnosis and etiology is important because certain eosinophilic syndromes have specific and effective treatments (generally corticosteroids for most etiologies, imatinib for PDGRFA mutations, rituximab for IgG4 disease, and immunosuppression for vasculitis).5
This case highlights the importance of CMR to define the etiology for cardiomyopathies, especially infrequent causes such as eosinophilic myocarditis. Furthermore, optimal evaluation and treatment of this group of patients requires a multidisciplinary effort among cardiologists, infectious disease specialists, hematologists, rheumatologists, and allergists.
References
- Kadkhodayan A, Chareonthaitawee P, Raman SV, Cooper LT. Imaging of Inflammation in Unexplained Cardiomyopathy. JACC Cardiovasc Imaging 2016;9:603-17.
- Moosig F, Richardt G, Gross WL. A fatal attraction: eosinophils and the heart. Rheumatology (Oxford) 2013;52:587-9.
- Cooper LT Jr. Eosinophilic Myocarditis as a Cause of Acute Cardiac Syndromes: The Importance of Awareness. J Am Coll Cardiol 2017;70:2376-7.
- Brambatti M, Matassini MV, Adler ED, Klingel K, Camici PG, Ammirati E. Eosinophilic Myocarditis: Characteristics, Treatment, and Outcomes. J Am Coll Cardiol 2017;70:2363-75.
- Cheung CC, Constantine M, Ahmadi A, Shiau C, Chen LYC. Eosinophilic Myocarditis. Am J Med Sci 2017;354:486-92.
- Klion AD. How I treat hypereosinophilic syndromes. Blood 2015;126:1069-77.