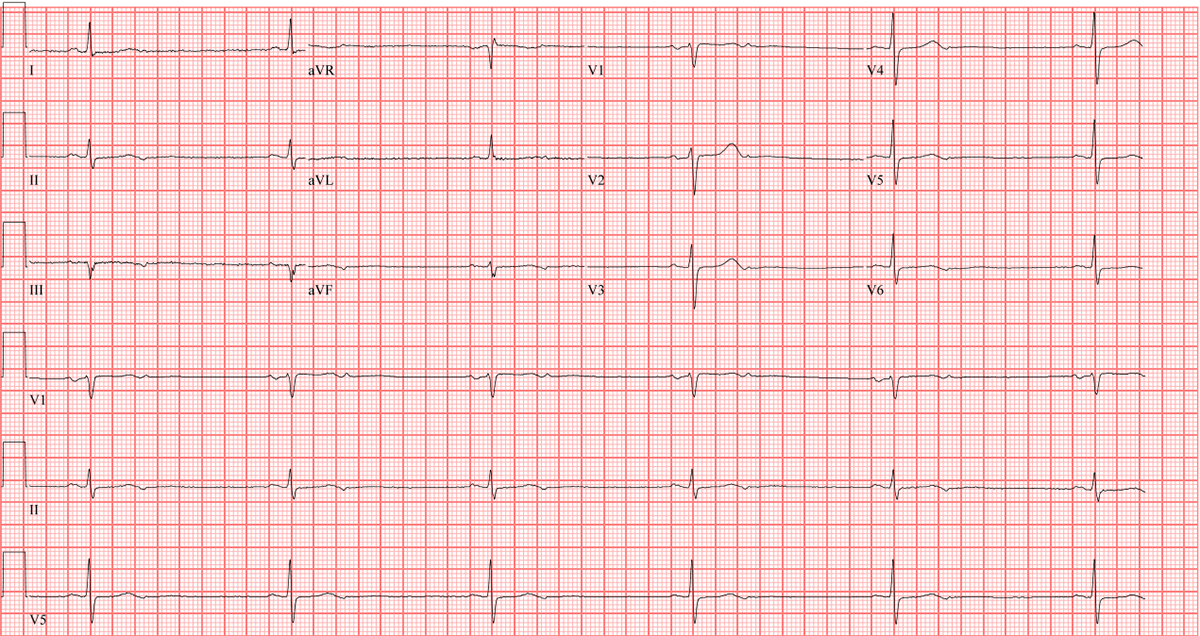
A 73-year-old woman with a history of remote staphylococcus lugdensis tricuspid valve endocarditis treated medically, end-stage renal disease on intermittent hemodialysis, hypertension, and diabetes presents to the Emergency Department with nausea and lightheadedness for 1 week. She has a heart rate of 30 beats per minute (bpm) and a blood pressure of 160/70 mm Hg. She denies having syncope. Her home medications include clonidine 0.2 mg three times daily, losartan 50 mg daily, and metoprolol 100 mg two times daily. Her potassium is 4.6 mmol/L and magnesium is 2.4 mmol/L. Her electrocardiogram (ECG) is shown in Figure 1.
Figure 1
Figure 1
Which of the following most likely describes the findings on this ECG?
Show Answer
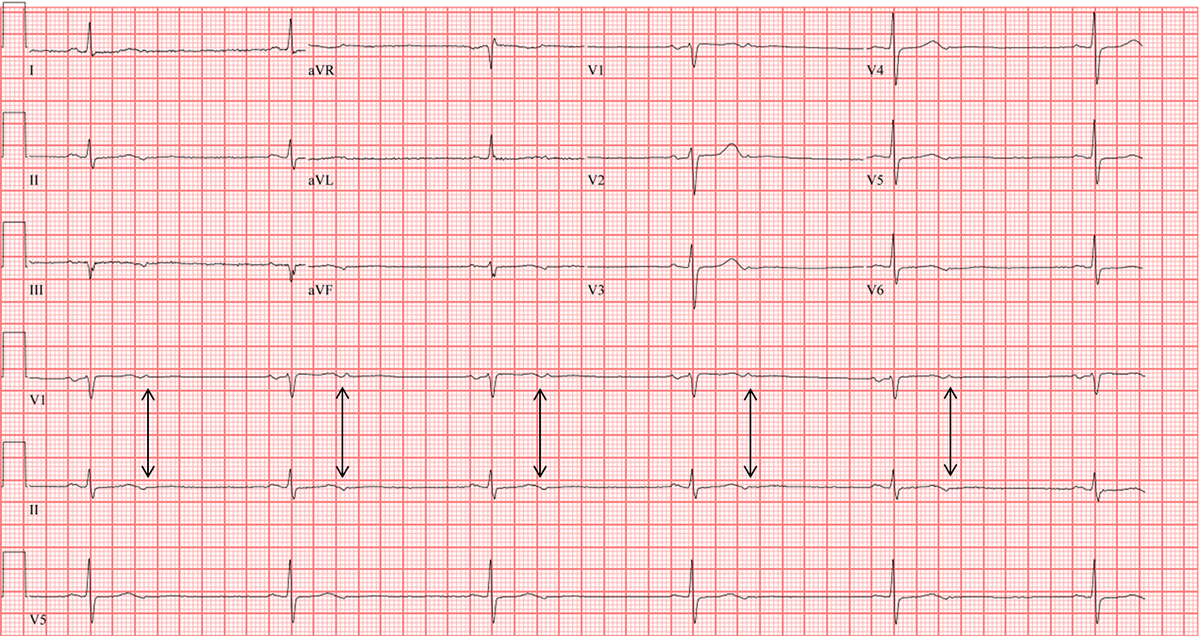
The correct answer is: B. Normal sinus rhythm with blocked PAC's.
The patient is experiencing bradycardia with palpation of her pulse because she is having bigeminal PAC's, and each PAC is being blocked in the AV node. The atrial contraction corresponding to the PAC is marked with an arrow (Figure 2).
Figure 2
Figure 2
The morphology of the P wave is different than that of the sinus beat. Additionally, the P wave vector as seen in lead II, is negative. This supports the finding that the patient is having blocked PAC's, and it speaks against sinus rhythm with 2:1 AV block.
The waves are unlikely to be U waves, which usually follow the polarity of the T wave (in the absence of ischemia and/or severe hypertension). Additionally, the fact that she has had an abrupt change in her heart rate (normally 60-70 bpm, now 30 bpm) also supports sinus rhythm with blocked PAC's over U waves.1
Finally, this does not represent solely sinus bradycardia as there is a deflection following the T wave indicated by the arrow, which represents a blocked PAC.
The patient's clonidine and metoprolol were held on admission due to bradycardia. Her dizziness and lightheadedness improved with IV fluids and increased oral intake. Additionally, she was kept on telemetry, and had a reduction in her PAC's during admission. Her heart rate improved, with a rhythm strip shown below. As seen in the rhythm strip (Figure 3), there is no longer the negative deflection at the end of the T wave, which represented a PAC.
Figure 3
Figure 3
Caption-Caption-Caption
References
Surawicz B, Kemp RL, Bellet S. Polarity and Amplitude of the U Wave of the Electrocardiogram in Relation to that of the T Wave. Circulation 1957;15::90-7.