A 79-year-old former senior triathlete with a history of recently diagnosed diabetes (hemoglobin A1C of 14.4% (normal < 5.7%) and congestive heart failure of two years duration presented for evaluation of pericardial disease.
He had been in excellent health until late 2016, when he was diagnosed with insulin-dependent diabetes and subsequently hospitalized with New York Heart Association (NYHA) stage III congestive heart failure. After subsequent hospitalizations for congestive heart failure, he was referred to a tertiary care center for further evaluation in January 2017.
On examination, his blood pressure was 127/80 mmHg, heart rate was 67 bpm and regular, and he saturated 95% oxygen on room air. His jugular venous pressure was measured at 17cm H20 with a positive Kussmaul's sign. Breath sounds were decreased 1/3 of the way bilaterally. A pericardial knock was present. Examination of the abdomen revealed ascites, and examination of the extremities showed tense edema. Serologic testing was significant for an elevated erythrocyte sedimentation rate (ESR) at 33mm/hr (normal <15mm/hr) and elevated C-reactive protein (CRP) at 14.7mg/dL (normal <0.9mg/dL). NT-ProBNP was elevated at 1104 pg/mL (normal <450 pg/mL). Electrocardiogram (ECG) (Figure 1) and chest x-ray (Figure 2) are shown below.
Figure 1
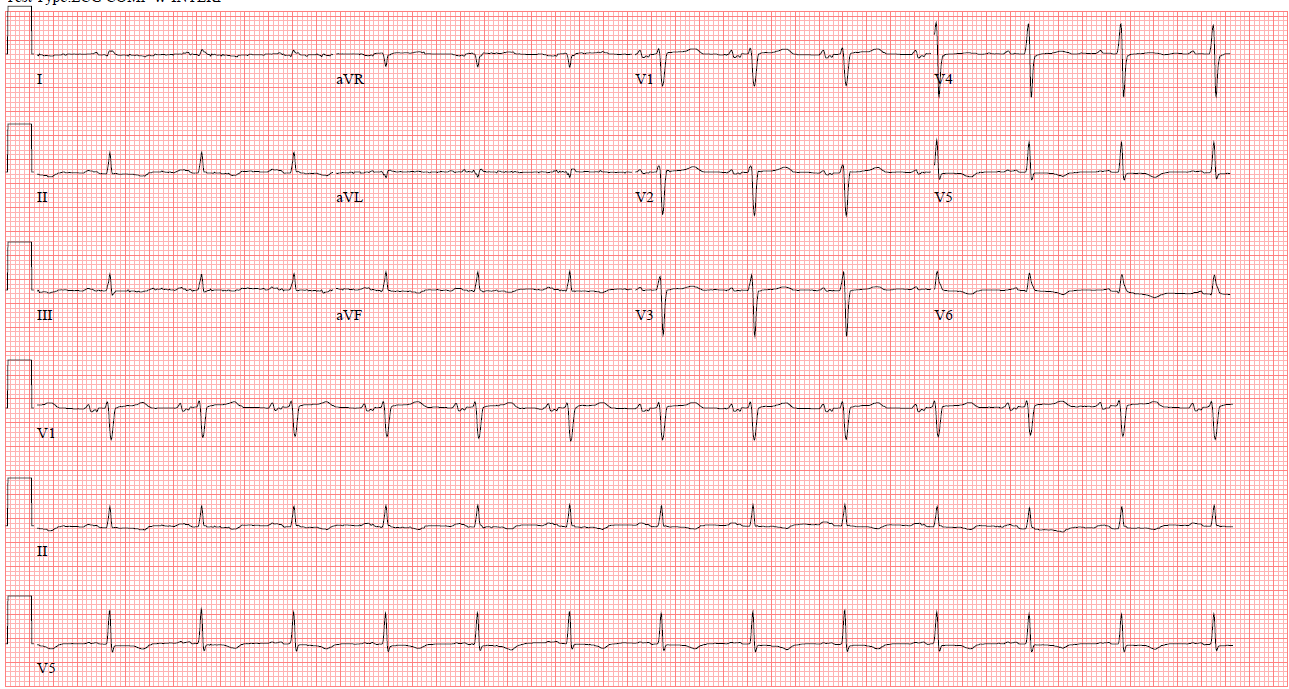 Figure 1: Electrocardiogram showing normal sinus rhythm and low voltages in the precordial leads.
Figure 2
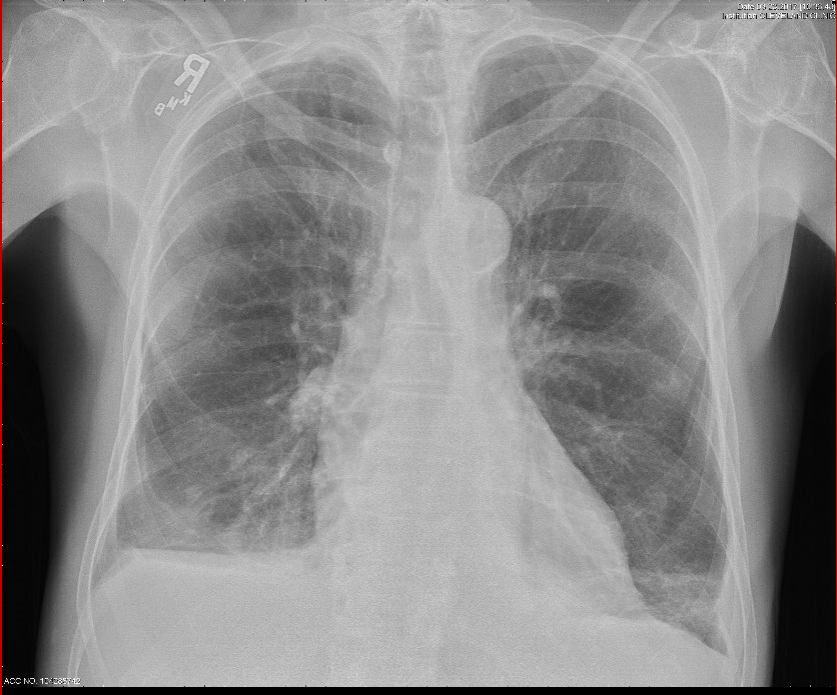 Figure 2: Chest x-ray showing prominent interstitial markings and a right sided pleural effusion.
His echocardiogram showed a septal bounce, shift of the septum leftward during inspiration, tethering of the right ventricle and right atrium during the cardiac cycle, and the Doppler findings in Figures 3 and 4.
Figure 3
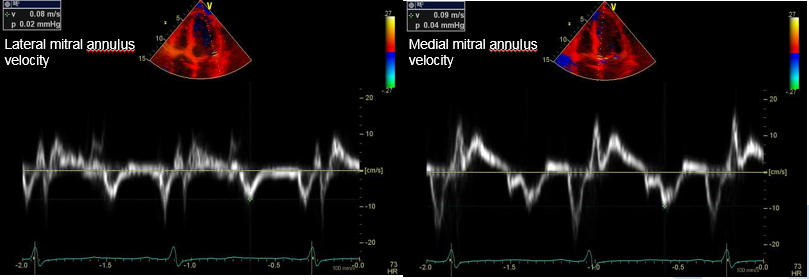 Figure 3: Tissue Doppler imaging showed medial e' > lateral e'.
Figure 4
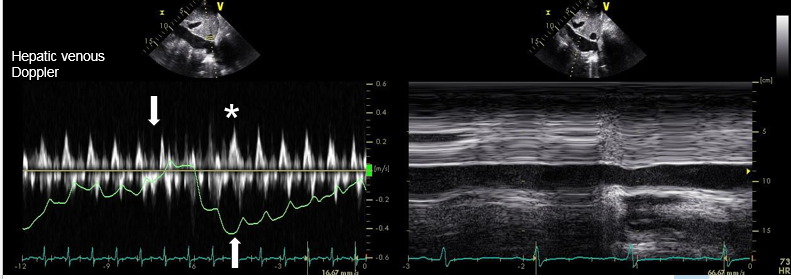 Figure 4: IVC exam showed hepatic diastolic flow reversal on expiration and a dilated IVC with less than 50% collapse on sniff testing. Downward arrow shows inspiratory phase, upward arrow shows expiratory phase. Asterisk shows pronounced diastolic wave during expiration.
Right heart catheterization showed equalization of left and right heart pressures: RA 22 mmHg, RV 37/22 mmHg, PA 34/21 (mean 27) with mean PCWP of 21 mmHg. Cardiac magnetic resonance imaging (MRI) was performed, showing findings consistent with acute pericarditis with constrictive physiology, and a diagnosis of transient constrictive pericarditis (transient CP) was made. The patient was started on ibuprofen, and colchicine. Due to his difficult-to-control diabetes, the patient could not tolerate corticosteroids, and the decision was made to start anakinra 100mg twice daily. On follow-up visits, the patient's symptomatology improved, his ESR and CRP normalized to 2mm/hr and 0.1mg/dL respectively, and he was able to be weaned off of anakinra over a 9-month period. His serial echocardiograms showed resolution of constrictive physiology.
The correct answer is: C. Delayed gadolinium enhancement and increased signal on T2-weighted STIR sequences.
Transient constrictive pericarditis (CP) is a clinical syndrome resulting from pericardial inflammation, edema and fibrin deposition. This, over time, leads to resultant pericardial thickening and constrictive physiology. This is in contrast with the more fixed pericardial fibrosis and calcification seen in other forms of CP. Clinically, transient CP presents with heart failure due to limited biventricular filling, as seen in our patient. Transient CP may respond to anti-inflammatory therapy with resolution of symptoms and resolution of constrictive physiology. In this sense, it can be thought of as an early manifestation in the spectrum of constrictive pericardial disease. As such, recognition and adequate anti-inflammatory treatment is key to prevent progression to more permanent constrictive disease which necessitates more invasive treatment such as pericardiectomy. Our patient presented early in the course of his disease and was able to have prompt recognition and treatment. After several months of anti-inflammatory treatment, his symptoms of congestive heart failure resolved, and imaging no longer suggested ongoing inflammation or edema. He did not require any surgical management for his transient CP.
The spectrum of both pericarditis and constrictive pericarditis can be thought of as consisting of acute, subacute, and chronic phases. For pericarditis, the acute phase manifests clinically with pleuritic chest pain, ECG changes including diffuse ST elevation, presence of a pericardial friction rub and pericardial effusion. MRI imaging at this time would reveal increased T2 STIR signal (T2+) representing edema and delayed gadolinium hyperenhancement (DHE+) representing inflammation. Recurrences affect 15-30% of individuals initially effected and have a latency of 4-6 weeks. These patients will also have DHE+, but may or may not display T2+. Pericarditis is termed chronic when the duration exceeds 3 months, and is not expected to have T2+ but will still show DHE+.
Constrictive pathophysiology can also be divided into three phases, which are termed transient, subacute and chronic. In transient CP, the presence of edema and inflammation render the pericardium stiff and poorly compliant. These patients go on to have constrictive physiology on echocardiogram and can manifest with heart failure. Like acute pericarditis, MRI imaging will show DHE+ and T2+. A subset of these patients can recover with appropriate treatment. When inflammation and edema persist, this is termed subacute or effusive-constrictive disease. These patients continue to have DHE+ and may or may not have T2+. Persistent underlying inflammation can lead to chronic constrictive physiology with DHE+. Finally, burnt-out constrictive pericarditis present with neither inflammation nor edema on imaging, but chronic constrictive physiology and the presence of pericardial calcification.
Figure 5
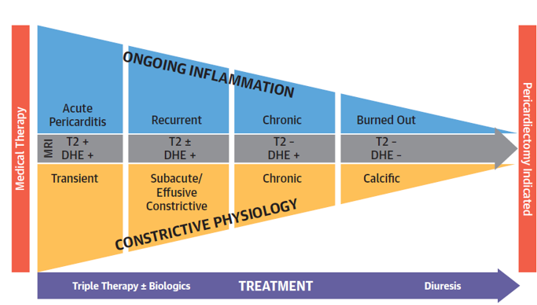 Figure 5: Stages of pericardial disease. The top graphic shows the progression of pericardial disease and constrictive pericarditis. The natural history of both disease states includes acute, subacute and chronic states. The two disease states "converge" around burnt out pericardial disease. Chetrit M. et al. JACC Cardiovasc Imaging 20191
Figure 5: Stages of pericardial disease The top graphic shows the progression of pericardial disease and constrictive pericarditis. The natural history of both disease states includes acute, subacute and chronic states. The two disease states "converge" around burnt out pericardial disease. Chetrit M. et al. JACC Cardiovasc Imaging 20191
Figure 6
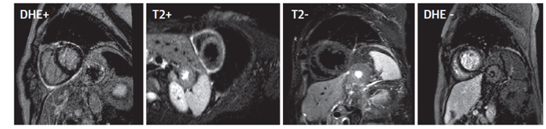 Figure 6: Imaging changes during treatment of pericarditis. The two images on the left show a patient initially diagnosed with pericarditis, showing a white rim of edema and inflammation around the pericardium. The two images on the right show the same patient after treatment with anti-inflammatory therapy showing resolution of inflammation and edema. Chetrit M. et al. JACC Cardiovasc Imaging 20191
Figure 6: Imaging changes during treatment of pericarditis. The two images on the left show a patient initially diagnosed with pericarditis, showing a white rim of edema and inflammation around the pericardium. The two images on the right show the same patient after treatment with anti-inflammatory therapy showing resolution of inflammation and edema. Chetrit M. et al. JACC Cardiovasc Imaging 20191
References
- Chetrit M, Xu B, Kwon DH, et al. Imaging-guided therapies for pericardial diseases. JACC Cardiovasc Imaging 2019.[online ahead of print].