A 64-year-old woman with past medical history of relapsed Hodgkin's lymphoma and asthma presented to the hospital for progressive difficulty walking, back pain associated with productive cough, and chills. She has been receiving radiation therapy for metastases in her spine but has been having increasing back pain. She had an episode of bowel incontinence and so was admitted for concern for cord compression. She was found to have fever, hypotension, lactic acidosis, and mild hyponatremia along with pancytopenia. She was started on aztreonam and vancomycin for febrile neutropenia.
Patient's vitals at presentation were blood pressure of 84/48 mmHg, pulse of 109 to 130 beats per minute, temperature of 39.1 degrees celsius and oxygen saturation of 90% on room air. Sodium was 131 mMol/L (136-145 mMol/L), BUN 42 mg/dL (7-25 mg/dL), Creatinine 1.03 mg/dL (0.6 to 1.2 mg/dL). Initial troponin I was normal at <0.04 ng/mL, WBC was 0.3 K/cumm (3.5 to 10.6 K/cumm), hemoglobin of 6.7 gm/dL (11.5 to 15.1 gm/dL) with platelets of 12 K/cumm (150-450 K/cumm). Blood cultures grew Escherichia coli and Klebsiella pneumonia. Magnetic resonance imaging (MRI) of lumbar spine showed possible epidural collection.
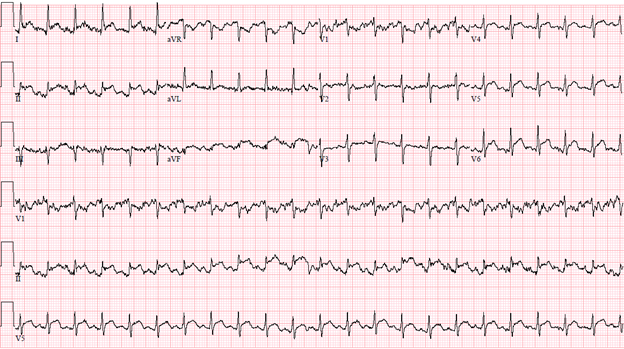
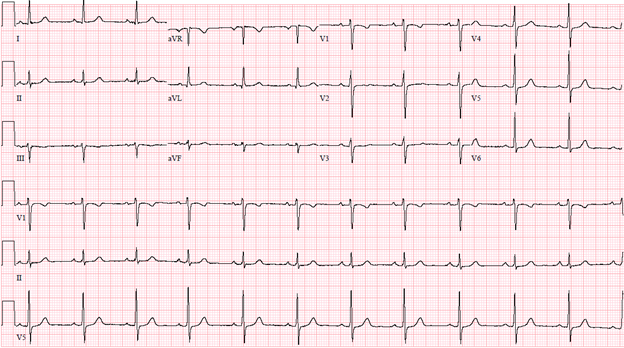
Patient had tachycardia for which she had an electrocardiogram (ECG) done (Figure 1) and cardiology was consulted stat due to acute findings compared to her baseline ECG (Figure 2). Examination revealed normal heart sounds and no additional sounds such as murmurs, rubs or gallops. An echocardiogram was performed which showed normal left ventricular size and thickness, mildly reduced left ventricular systolic function with ejection fraction of 45-50%, and no regional wall motion abnormalities, normal right ventricular size and function, and trivial posterior pericardial effusion.
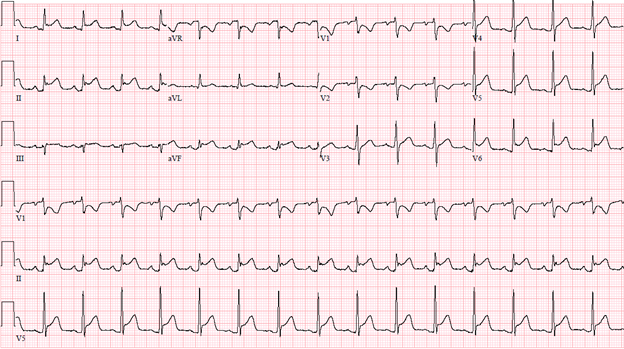
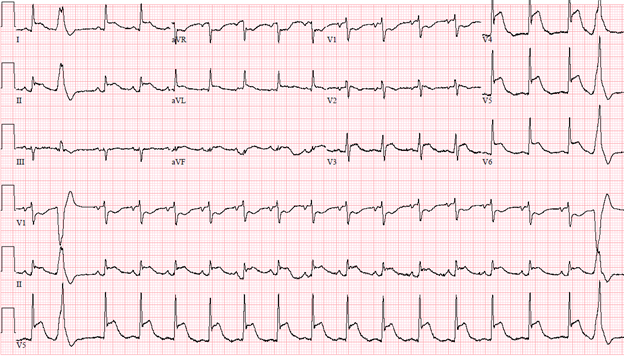
Given her severe thrombocytopenia, lack of initial chest pain, and no wall motion abnormalities on echocardiogram, she was managed conservatively. She later started to have mild chest pain on deep breathing. Follow up ECG's over the course of the day (Figure 3 and Figure 4) are shown below. Troponins trended up to 2.70 ng/mL (Normal <0.04 ng/mL) within 24 hours and down to 0.32 ng/mL within the next 24 hours. D-dimer was elevated to 3.34 mg/L FEU (Normal high <0.50 mg/L FEU). BNP increased from 167 pg/mL (<101 pg/mL) at admission to 2443 pg/mL in 24 hours.
Figure 1: Initial ECG
Figure 2: Baseline ECG
Figure 3: ECG at 6 hours
Figure 4: ECG at 18 hours
The correct answer is: 4. Acute myopericarditis.
This patient does not have the clinical presentation of acute coronary syndrome or acute pulmonary embolism. The clinical course, widespread ST elevations, lack of suggestive echocardiographic findings, and relatively minor troponin changes are most consistent with acute myopericarditis (Option 4) with evolutionary ECG changes. While an ischemia evaluation is indicated in the setting of dynamic electrocardiographic changes such as these to rule out acute coronary syndrome, this was not pursued in this case, given significant thrombocytopenia, worsening sepsis and overall poor prognosis due to her cancer and comorbidities. In suspected ST elevation myocardial infarction with thrombocytopenia, emergent left heart catheterization may be done with platelet transfusions and either cardiac catheterization or computed tomography (CT) coronary angiography may be pursued in those with suspected non-ST elevation myocardial infarction. A cardiac MRI study would help confirm the diagnosis of myopericarditis.
Cancer and cardiovascular disease share common risk factors and patients with cancer who present with acute ST elevation myocardial infarction should be evaluated like any other high risk patient with ST elevation.1 Observational data have shown that patients with cancer who present with acute coronary syndromes have lower utilization of percutaneous coronary intervention (PCI) and in those who had PCI, a lower use of drug eluting stents.2 This has significant implications in terms of morbidity and mortality in addition to the poor prognosis in some cancer patients such as in lung cancer with cardiovascular disease.3 However, this patient did not have any history suggestive of acute coronary syndrome. She presented for non-cardiac complaints and does not have features of typical chest pain or angina equivalent. Though PCI is not contraindicated in patients with thrombocytopenia, additional care in evaluation is warranted in these patients, taking into consideration other comorbidities, bleeding, and coagulation abnormalities, before further steps are undertaken.
A quick bedside focused echocardiogram is the next best step, which will help in evaluating for any wall motion abnormalities in this situation when the likelihood of myocardial infarction is low. Close monitoring with repeat ECGs and frequent clinical assessments are warranted. In this patient, she had relatively mild elevation of troponin which peaked at 2.70 ng/dL within 24 hours but rapid decline thereafter and echocardiogram showed mildly reduced LV function without any wall motion abnormalities. Patient's presentation is not suggestive of septic emboli/bacterial endocarditis (Option 2).
Acute pericarditis (Option 3) is diagnosed clinically when two or more of the following criteria are met based on European Society of Cardiology (ESC) 2015 guidelines: 1. Chest pain with deep breathing, which is worse on lying down and improves on leaning forward; 2. ECG changes of widespread ST elevations and PR depression; 3. Pericardial rub; 4. New or worsening pericardial effusion.4 This patient had pleuritic chest pain with widespread ECG changes. Some patients with pericarditis may have significant involvement of myocardium especially as noted with cardiotropic viruses or other infectious causes.
Perimyocarditis indicates coexistent pericarditis and myocarditis with major involvement of myocardium, while myopericarditis (Option 4) indicates major involvement of pericardium. In the spectrum of involvement, patients with biomarker elevation with normal or mildly reduced LV systolic function are deemed to have myopericarditis and those with significant LV dysfunction or wall motion abnormalities are considered to have perimyocarditis. However, in contrast to acute coronary syndrome, the wall motion abnormalities do not follow typical coronary distribution patterns.5 A diagnosis of pericarditis or myopericarditis/perimyocarditis is sometimes a diagnosis of exclusion for patients who may present with atypical ST segment elevation. The ESC 2015 guidelines on pericardial diseases do recommend a coronary angiogram to rule out acute coronary syndrome in pericarditis with associated myocarditis (Class Ic) based on clinical presentation and risk factor assessment.4 Radiation associated pericardial disease as in patients with Hodgkin's lymphoma may present early or late and can have severe consequences in some patients.6-10
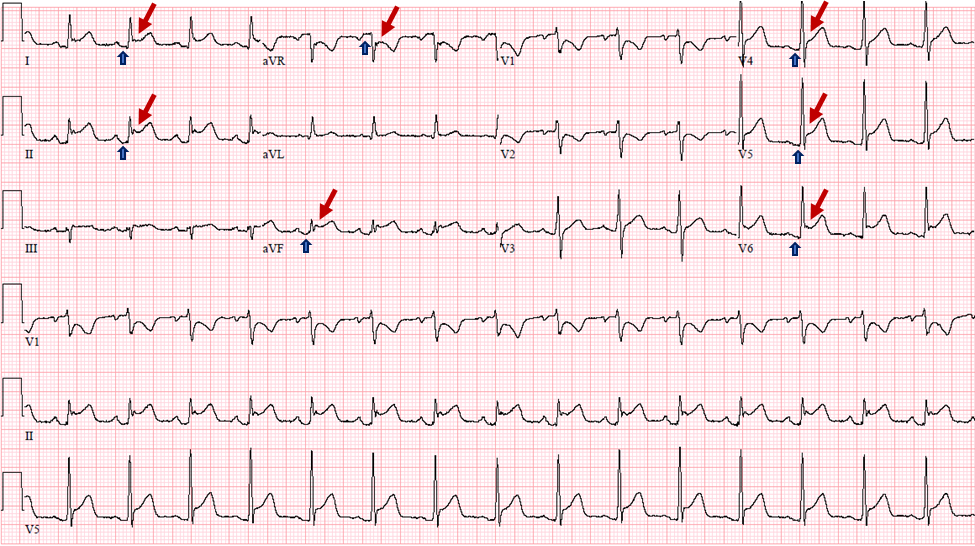
The pericardium is electrically inert but the electrocardiographic changes seen are due to superficial subepicardial myocarditis.11 The following are the classic ECG findings reported in pericarditis:12-14
Stage 1: Widespread concave ST elevation and PR depression. Reciprocal ST depression and PR elevation in lead aVR with or without V1. Sinus tachycardia. Electrocardiographic features occur over a period of days. (As seen on this patients' ECG Figure 5)
Stage 2: Normalization of ST changes. Generalized T wave flattening over 1-3 weeks.
Stage 3: T wave inversion. (About 3 weeks to few weeks)
Stage 4: Normalization of T waves. (Few weeks)
Figure 5: Electrocardiographic signs seen in pericarditis: Widespread ST segment (Red arrows) elevation and PR segment (Blue arrow) depressions with reciprocal changes in lead aVR and V1.
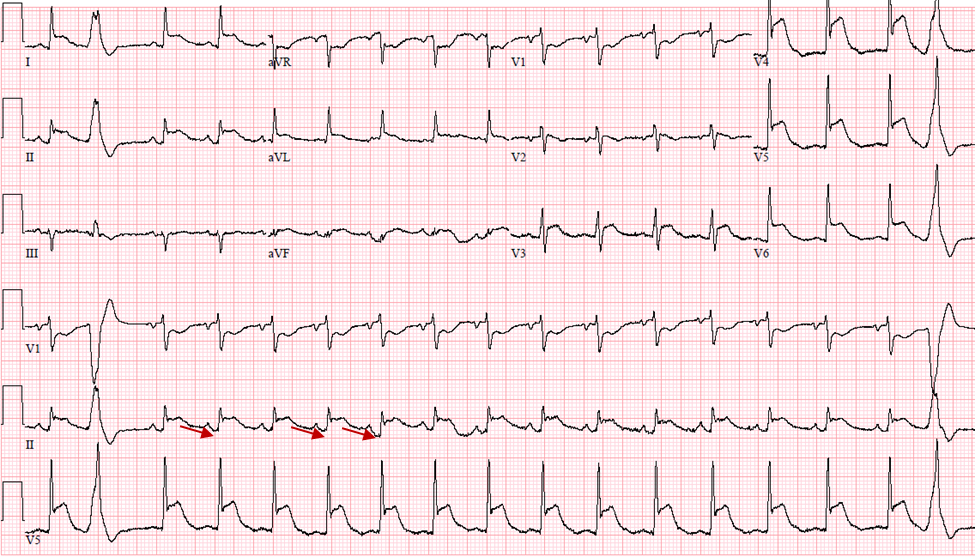
Spodick's sign or down sloping TP segment has been reported to be present in anywhere between 29%-80% of patients with acute pericarditis. It is best seen in leads II and V5, V6. It may help in differentiating from acute coronary syndromes when used along with PR depression.15-17
Figure 6: Spodick's sign: Down sloping TP segment in lead II (Red arrows)
Myocarditis patients may have sinus tachycardia, non-specific ST-T wave changes, conduction abnormalities and ventricular tachycardia.18 Acute myocardial infarction from coronary artery thrombosis (Option 1) presents with ST elevation with reciprocal changes which need to be differentiated from pericardial syndromes. This differentiation is of much significance as some treatments such as anticoagulation and anti-platelets may lead to bleeding into pericardial sac in pericarditis/perimyocarditis and also for prognosis, where missing a diagnosis of acute coronary syndrome such as with acute left main or proximal left anterior descending involvement can be fatal. Various electrocardiographic criteria have been proposed to help differentiate such as QRS prolongation, QT interval shortening seen in ischemia.19,17,5,20,21,16 Lead aVR or the "forgotten lead" may give additional clues. For example, ST segment elevation in lead aVR and aVL or ST elevation in lead aVR more than that in lead V1 indicates left main coronary artery occlusion while PR elevation in lead aVR suggests pericarditis.22-29,5,20,21
Risk of venous thromboembolism is high in patients with cancer and those with acute pulmonary embolism (Option 5) may present with pleuritic chest pain as well as varied ECG findings. Sinus tachycardia, right heart strain patterns and/or the classically reported S1Q3T3 pattern, known as the McGinn-White sign, may be seen, but the above evolutionary and widespread ST elevations are unlikely.30,31
References
- Koene RJ, Prizment AE, Blaes A, Konety SH. Shared risk factors in cardiovascular disease and cancer. Circulation 2016;133:1104-14.
- Pothineni NV, Shah NN, Rochlani Y, et al. Temporal trends and outcomes of acute myocardial infarction in patients with cancer. Ann Transl Med 2017;5:482.
- Potts JE, Iliescu CA, Lopez Mattei JC, et al. Percutaneous coronary intervention in cancer patients: a report of the prevalence and outcomes in the United States. Eur Heart J 2019;40:1790-800.
- Adler Y, Charron P, Imazio M, et al. 2015 ESC guidelines for the diagnosis and management of pericardial diseases: the task force for the diagnosis and management of pericardial diseases of the European Society of Cardiology (ESC)Endorsed by: The European Association for Cardio-Thoracic Surgery (EACTS). Eur Heart J 2015;36:2921-64.
- Ivanov I, Dejanovic J, Ivanov O, Petrovic M, Jung R, Panic G. Myopericarditis--diagnostic dilemmas in relation to acute myocardial infarction. Med Pregl 2013;66:396-400.
- Gutierrez CA, Just-Viera JO. Clinical spectrum of radiation induced pericarditis. Am Surg 1983;49:113-5.
- Mill WB, Baglan RJ, Kurichety P, Prasad S, Lee JY, Moller R. Symptomatic radiation-induced pericarditis in Hodgkin's disease. Int J Radiat Oncol Biol Phys 1984;10:2061-5.
- Desai MY, Jellis CL, Kotecha R, Johnston DR, Griffin BP. Radiation-associated cardiac disease: a practical approach to diagnosis and management. JACC Cardiovasc Imaging 2018;11:1132-49.
- Desai MY, Windecker S, Lancellotti P, et al. Prevention, diagnosis, and management of radiation-associated cardiac disease: JACC Scientific Expert Panel. J Am Coll Cardiol 2019;74:905-27.
- Szpakowski N, Desai MY. Radiation-associated pericardial disease. Curr Cardiol Rep 2019;21:97.
- Spodick DH. Mechanisms of acute epicardial and myocardial injury in pericardial disease. Chest 1998;113:855-6.
- Spodick DH. Electrocardiogram in acute pericarditis. Distributions of morphologic and axial changes by stages. Am J Cardiol 1974;33:470-4.
- Spodick DH. Differential characteristics of the electrocardiogram in early repolarization and acute pericarditis. N Engl J Med 1976;295:523-6.
- Spodick DH. Acute pericarditis: classic electrocardiogram. Am J Geriatr Cardiol 2003;12:266.
- Makaryus JN, Makaryus AN, Boal B. Spodick's sign. Am J Med 2008;121:693-4.
- Chaubey VK, Chhabra L. Spodick's sign: a helpful electrocardiographic clue to the diagnosis of acute pericarditis. Perm J 2014;18:e122.
- Witting MD, Hu KM, Westreich AA, Tewelde S, Farzad A, Mattu A. Evaluation of Spodick's sign and other electrocardiographic findings as indicators of STEMI and pericarditis. J Emerg Med 2020;58:562-69.
- Butta C, Zappia L, Laterra G, Roberto M. Diagnostic and prognostic role of electrocardiogram in acute myocarditis: a comprehensive review. Ann Noninvasive Electrocardiol 2019;25:e12726.
- Lee PT, See CK, Chiam PTL, Lim ST. Electrocardiographic changes in acute perimyocarditis. Singapore Med J 2015;56:e1-3.
- Rossello X, Wiegerinck RF, Alguersuari J, et al. New electrocardiographic criteria to differentiate acute pericarditis and myocardial infarction. Am J Med 2014;127:233-9.
- Celik T, Ozturk C, Balta S, Iyisoy A. The role of combined electrocardiogram criteria in differential diagnosis of acute pericarditis: PR segment and QT interval. Am J Emerg Med 2016;34:1309.
- George A, Arumugham PS, Figueredo VM. aVR - the forgotten lead. Exp Clin Cardiol 2010;15:e36-44.
- Kireyev D, Arkhipov MV, Zador ST, Paris JA, Boden WE. Clinical utility of aVR-the neglected electrocardiographic lead. Ann Noninvasive Electrocardiol 2010;15:175-80.
- Williamson K, Mattu A, Plautz CU, Binder A, Brady WJ. Electrocardiographic applications of lead aVR. Am J Emerg Med 2006;24:864-74.
- Rostoff P, Piwowarska W, Gackowski A, et al. Electrocardiographic prediction of acute left main coronary artery occlusion. Am J Emerg Med 2007;25:852-5.
- Ching S, Ting SM. The forgotten lead: aVR in left main disease. Am J Med 2015;128:e11-3.
- Alherbish A, Westerhout CM, Fu Y, et al. The forgotten lead: does aVR ST-deviation add insight into the outcomes of ST-elevation myocardial infarction patients? Am Heart J 2013;166:333-9.
- Vorobiof G, Ellestad MH. Lead aVR: dead or simply forgotten? JACC Cardiovasc Imaging 2011;4:187-90.
- Spodick DH. All tombstones are not equal. Lancet 1993;342:1000.
- McGinn S, White PD. Acute cor pulmonale resulting from pulmonary embolism: its clinical recognition. JAMA 1935;104:1473-80.
- Digby GC, Kukla P, Zhan ZQ, et al. The value of electrocardiographic abnormalities in the prognosis of pulmonary embolism: a consensus paper. Ann Noninvasive Electrocardiol 2015;20:207-23.