ECG of the Month: Bizarre T Waves: What Do They Mean? (JACC: Case Reports)
Editor's Note: This ECG of the Month was adapted from a JACC: Case Reports ECG Challenge. You can access the original article here.
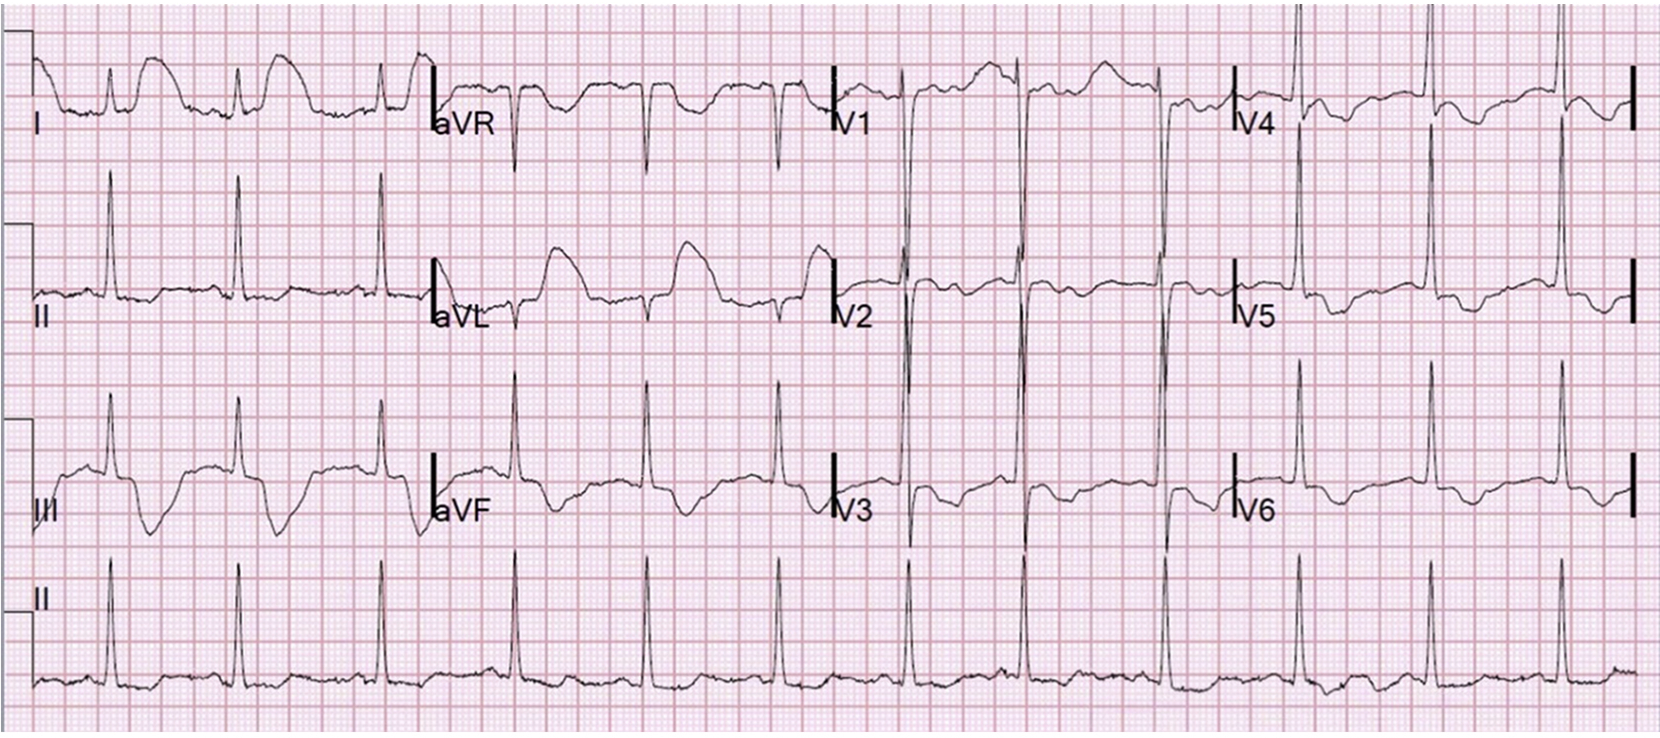
A 60-year-old patient with a medical history of end-stage renal disease on dialysis presented to the emergency department with dyspnea (Figure 1).
Figure 1: Initial Electrocardiogram
Figure 1

Which of the following is the correct diagnosis?
Show Answer
The correct answer is: E. Arterial pulse tapping artifact
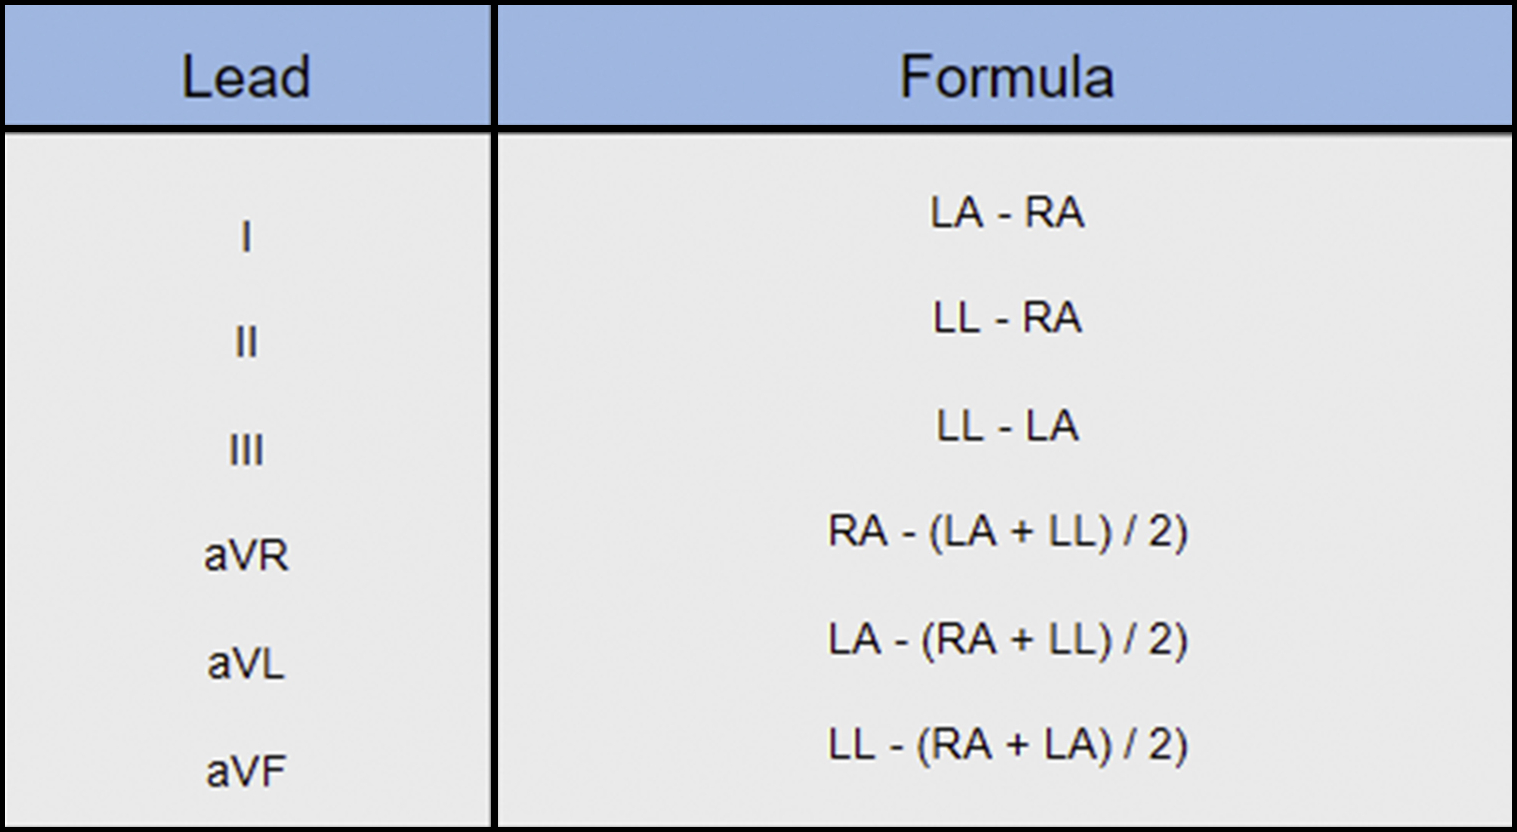
The abnormal appearance of the T waves in all leads except for lead II was caused by the left arm (LA) electrode being placed near an artery—in this case, the patient's left upper extremity dialysis fistula. This finding, referred to as arterial pulse tapping artifact, is generated by the movement of the electrode with each pulsatile motion of blood flow through the fistula. Careful inspection of the electrocardiogram (ECG) revealed that the ST-segment elevation (STE) is related to each QRS, with each artifact at exactly the same time of the QRST complex; therefore, it is generated by the cardiac cycle rather than by something external (e.g., patient movement).1,2 Lead II was the only lead unaffected because it was the only lead that did not manifest any effect of the left limb electrode in its voltage calculation: II = F – R. The other lead voltages are calculated as per Figure 2.
Figure 2: Lead Voltage Calculations
Figure 2

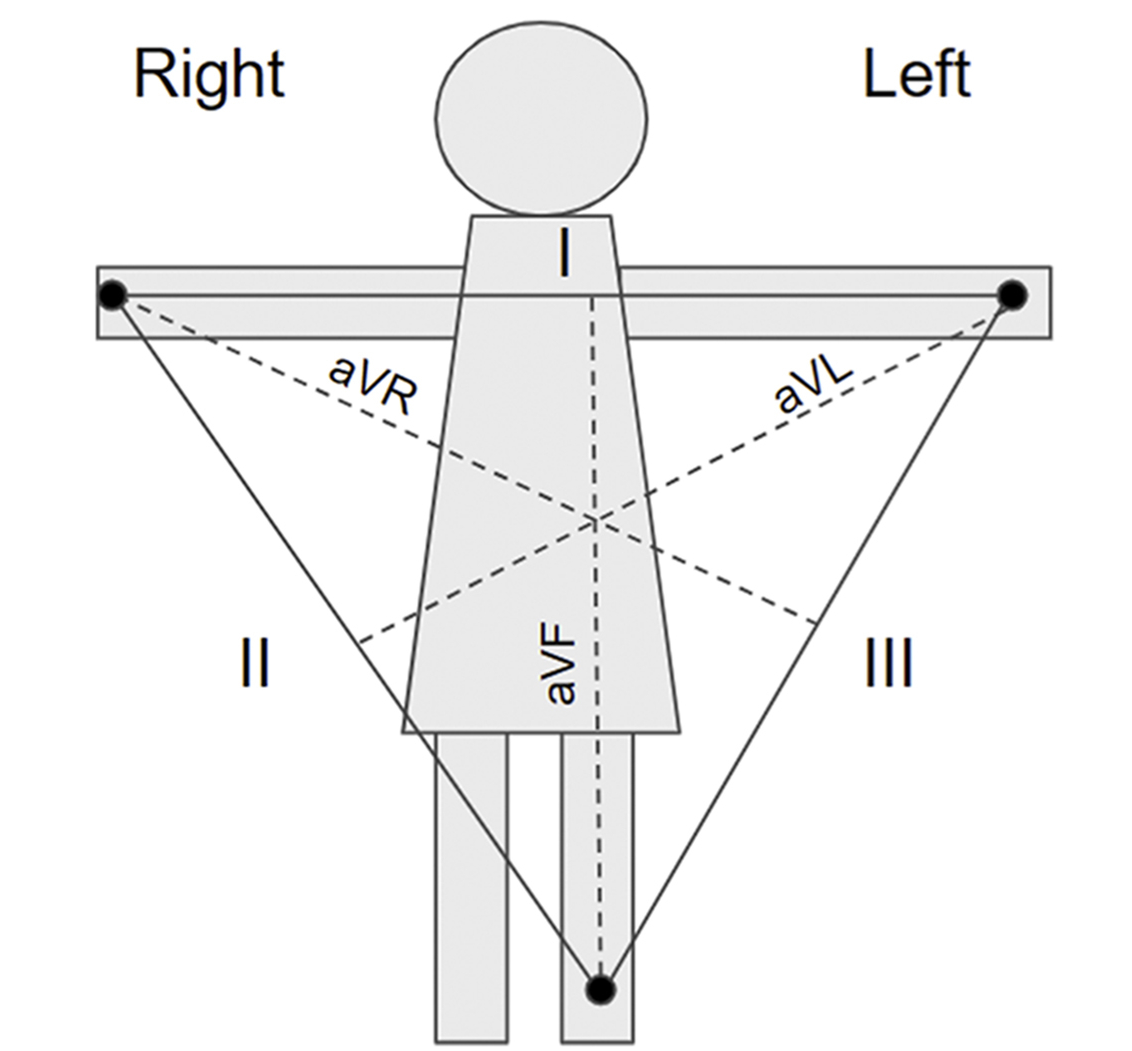
This can be visually conceptualized by review of Einthoven's triangle (Figure 3).
Figure 3: Einthoven's Triangle
Figure 3

The precordial leads are also affected by this phenomenon, although they do not directly interface with the fistula. This is because the negative pole of the unipolar leads is calculated by the average generated by the 3 limb leads, referred to as the Wilson central terminal.1 The Wilson central terminal uses the 3 limb leads to create an average potential across the body, thereby acting as the negative pole of the unipolar leads. Therefore, the left limb lead will still influence the precordial lead voltage calculation, although to a lesser extent than leads I and III. This difference accounts for the comparatively smaller changes in amplitude in the precordial leads.
Several publications of arterial pulse tapping artifacts might have been misinterpreted as an alternate etiology (e.g., coronary artery spasm or pancreatitis).3,4 This serves as a reminder of the dangers of early diagnostic closure and the need for expert ECG analysis. It is conceivable that this may have led to needless testing and treatment.
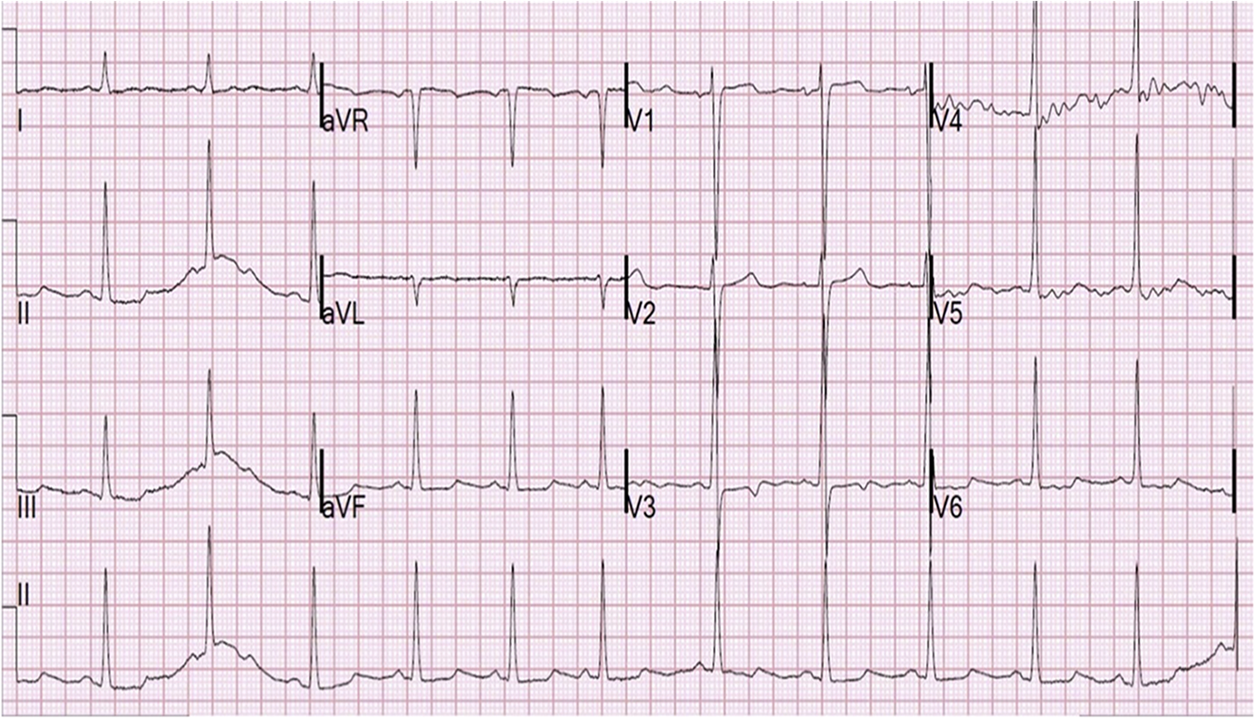
A repeat ECG was performed after moving the left limb lead away from the fistula (Figure 4), which demonstrated sinus arrhythmia with resolution of STE, with wander artifact only.
Figure 4: Repeat Electrocardiogram After Lead Repositioning
Figure 4

ECG artifacts are common and may often interfere with interpretation. When encountering unexpected ECG findings, careful inspection of both the ECG and lead positioning on the patient may help to identify the underlying cause. Bizarre appearing T waves in the distribution of a single lead should suggest arterial pulse tapping artifact.
References
- Aslanger E, Yalin K. Electromechanical association: a subtle electrocardiogram artifact. J Electrocardiol 2012;45:15-7.
- Sotananusak T, Meemook K. Asymptomatic ST-segment-elevation EG in patient with kidney failure. Circulation 2018;137:402-4.
- Hung SC, Chiang CE, Chen JD, Ding PY. Images in cardiovascular medicine: pseudo-myocardial infarction. Circulation 2000;101:2989-90.
- Ozhan H, Akdemir R, Duran S, et al. Transient silent ischemia after percutaneous transluminal coronary angioplasty manifested with a bizarre electrocardiogram. J Electrocardiol 2005;38:206-9.

