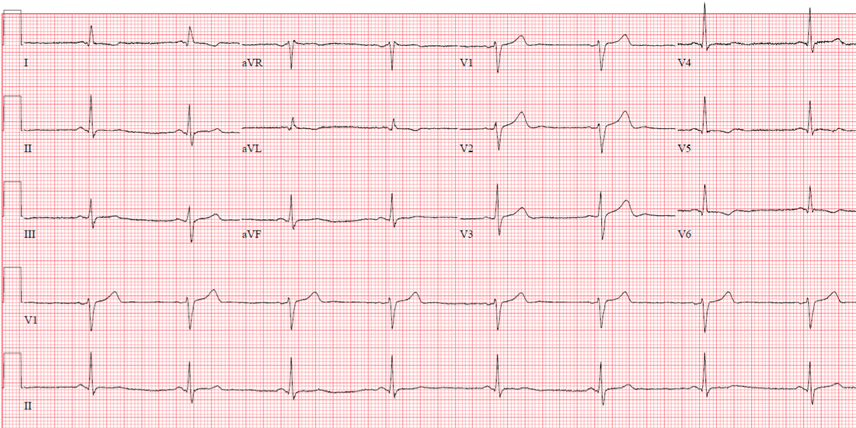
A 66-year-old male with a history of hyperlipidemia, hypertension, degenerative joint disorder, and gastroesophageal reflux disease (GERD), presented with shortness of breath and palpitation. Baseline electrocardiogram (ECG) showed sinus rhythm with T wave changes that could be related to lateral wall ischemia (Figure 1).
Figure 1: Baseline ECG sinus bradycardia with T wave abnormalities due to possible lateral wall ischemia
Figure 1
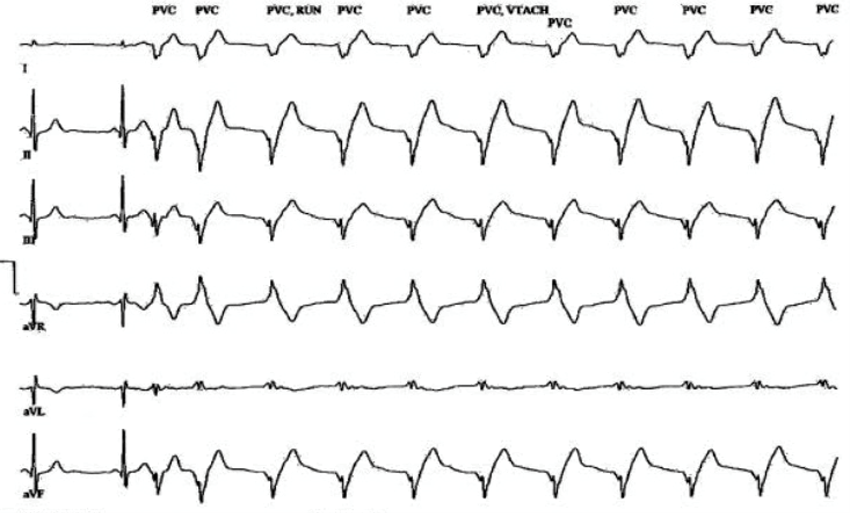
Echocardiogram showed mild dilated left ventricle (LV) and mild global LV systolic dysfunction with a left ventricular ejection fraction (LVEF) of 43%. He underwent a treadmill pharmacologic myocardial perfusion stress test that was aborted due to syncope associated with ventricular arrhythmia (VA). Post stress test, he became unresponsive with accelerated idioventricular rhythm (Figure 2) lasting 1 minute and 21 seconds. His rest myocardial perfusion images showed perfusion defect in the basal lateral wall. Urgent left heart catheterization (LHC) showed non-obstructive coronary artery disease (CAD) with a LVEF of 30-35%.
Figure 2: Accelerated idioventricular rhythm post stress test
Figure 2
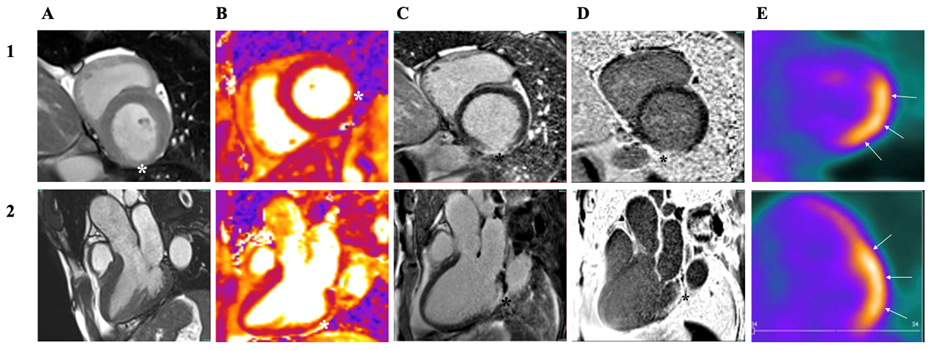
He was seen at our electrophysiology clinic where he was prescribed a wearable cardioverter defibrillator (WCD) and was initiated on guideline directed medical therapy (GDMT) for the treatment of heart failure (HF). Due to syncope and VA in the setting of unexplained LV dysfunction and the presence of perfusion defects unexplained by CAD, he underwent further evaluation of possible infiltrative and inflammatory myocardial disease with cardiac magnetic resonance (CMR) and positron emission tomography (PET). CMR imaging showed basal lateral scars with corresponding myocardial edema with sarcoidosis suggested in the differential diagnosis. CMR imaging as showing in Figure 3 (Panel A-D) demonstrates thinning and hypokinesis of the inferior basal wall (Panel A1*-2), T2 signal elevation (Panel B1-2*) and transmural infarct scar in the basal inferolateral wall (Panel C1-2, D1-2*).
PET scan showed hypermetabolic uptake in the lateral wall (Figure 3, Panel E1-2; arrows). This finding could be related to cardiac sarcoidosis (CS). There was a nodal uptake within the chest that is likely to be related to sarcoidosis. Blood work showed high serum angiotensin converting enzyme (ACE) activity, elevated serum lysozyme level and high serum soluble interleukin-2 receptor (sIL‐2R) levels.
Figure 3
Figure 3
Panel 1 – Basal short axis images
Panel 2 – Three chamber long axis images
Panel A – Cine images
Panel B – T2 mapping
Panel C – Late gadolinium enhancement imaging
Panel D – Short inversion time late gadolinium enhancement imaging
Panel E - 18F-fluorodeoxyglucose positron emission tomography
Panel 1 – Basal short axis images
Panel 2 – Three chamber long axis images
Panel A – Cine images
Panel B – T2 mapping
Panel C – Late gadolinium enhancement imaging
Panel D – Short inversion time late gadolinium enhancement imaging
Panel E - 18F-fluorodeoxyglucose positron emission tomography
High resolution computed tomography (CT) of the chest was reported as no hilar lymphadenopathy. There was one symptomatic non-sustained ventricular tachycardia on his on WCD.
What is the most appropriate next step?
Show Answer
The correct answer is: D. Secondary prevention ICD
Diagnosis of the CS as per the Heart Rhythm Society (HRS) expert consensus statement requires either histological or clinical pathways. Endomyocardial biopsy showing noncaseating granuloma establishes the histological diagnosis. The clinical diagnosis depends on proven extra CS biopsy, clinical, and imaging criteria.1,2
Our patient has symptomatic ventricular arrhythmia (VA), unexplained LV dysfunction, CMR and PET highly suggestive of active CS. However, there is no evidence of pulmonary or mediastinal sarcoidosis. Endomyocardial biopsy (EMB) is a reasonable option, however, this patient meets three major criteria for isolated CS according to the Japanese Circulation Society (JCS) guidelines,1 including VA, unexplained LV dysfunction, and abnormal CMR and PET scan findings. EMB in this case was not pursued as it will be associated with low yield due to the LV lateral wall location of myocardial inflammation. Negative biopsy findings will not alter the management.
Catheter ablation is a reasonable option in CS patients with VA who failed antiarrhythmic drug therapy, GDMT of HF, and immunosuppressive therapy in the absence of active inflammation. Successful catheter ablation of VA during active inflammation is limited due to edema that limits energy penetration and high recurrence of VA.2-4 Therefore, answer B is incorrect.
Immunosuppressive therapy should be started due to active inflammation in addition to optimal tolerated GDMT of HF with reduced ejection fraction (HFrEF), which showed improvement of LVEF as well as VA. Immunosuppressive therapy efficacy is variable and the corticosteroid effectiveness in suppressing VA is unclear.5 There is also a higher recurrence of active inflammation in the corticosteroid group at 46% compared to 17% in corticosteroid sparing immunosuppressive therapy group.6 Therefore, answer C is incorrect.
Since the patient has syncope and sustained VA, he will benefit from a secondary prevention ICD as a class I recommendation according to the 2017 American Heart Association/American College of Cardiology/HRS guideline for management of patients with ventricular arrhythmias and the prevention of sudden cardiac death regardless of the LVEF.7
References
Kawai H, Sarai M, Kato Y, et al. Diagnosis of isolated cardiac sarcoidosis based on new guidelines. ESC Heart Fail 2020;7:2662-71.
Birnie DH, Sauer WH, Bogun F, al. HRS expert consensus statement on the diagnosis and management of arrhythmias associated with cardiac sarcoidosis. Heart Rhythm 2014;11:1305–23.
Rosenfeld LE, Chung MK, Harding CV, et al. Arrhythmias in cardiac sarcoidosis bench to bedside: a case-based review. Circ Arrhythm Electrophysiol 2021;14:e009203.
Muser D, Santangeli P, Liang JJ, et al. Characterization of the electroanatomic substrate in cardiac sarcoidosis: correlation with imaging findings of scar and inflammation. JACC Clin Electrophysiol 2018;4:291–303.
Sadek MM, Yung D, Birnie DH, Beanlands RS, Nery PB. Corticosteroid therapy for cardiac sarcoidosis: a systematic review. Can J Cardiol 2013;29:1034–41.
Ballul T, Borie R, Crestani B, et al. Treatment of cardiac sarcoidosis: a comparative study of steroids and steroids plus immuno- suppressive drugs. Int J Cardiol 2019;276:208–11.
Al-Khatib SM, Stevenson WG, Ackerman MJ, et al. 2017 AHA/ACC/HRS guideline for management of patients with ventricular arrhythmias and the prevention of sudden cardiac death: a report of the American College of Cardiology/American Heart Association Task Force on Clinical Practice Guidelines and the Heart Rhythm Society. J Am Coll Cardiol 2018;72:e91–e220.