A 40-year-old woman is referred to the clinic with remarkable electrocardiographic (ECG) findings and New York Heart Association (NYHA) functional class II exertional dyspnea. She has no known history of pulmonary disease, smoking, cardiac disease, diabetes mellitus, or dyslipidemia. She denies alcohol or illicit drug use and takes no medications. She initially presented to her primary care provider because of a 6-month history of shortness of breath after walking two blocks. She denies angina, weight gain, fluid retention, or palpitations. Review of systems is notable for intermittent burning pain in her hands and feet and a rash on her back, both since childhood. Her family history is negative for premature coronary artery disease (CAD) or sudden death, but her mother had atrial fibrillation and died of heart failure at 61 years of age.
Physical examination findings are significant for mildly elevated blood pressure (148/88 mm Hg) and red-purple, nonblanching papules on her lower back (Figure 1). Otherwise, the cardiovascular (CV) examination findings are unremarkable with normal jugular venous pressure, and no rub, murmur, or rales. Laboratory examination shows hematology and chemistry panel values within the reference ranges, but she has moderate albuminuria (200 mg/g urinary albumin-to-creatinine ratio) and a mildly elevated N-terminal pro–B-type natriuretic peptide serum level (350 pg/mL). A high-sensitivity troponin serum assay and chest X-ray have unremarkable findings. An ECG is obtained (Figure 2). Transthoracic echocardiography shows normal left ventricular (LV) size with a mild increase in basal septal thickness (13 mm) (Figure 3). Ejection fraction is 55%. Also noted are mildly enlarged left atrium, grade II diastolic dysfunction, and mildly reduced regional longitudinal strain in the basal inferolateral wall (-15.8%).
Figure 1: Red-Purple, Nonblanching Papules on the Lower Back. Courtesy of Umer M, Kalra D.
Figure 1
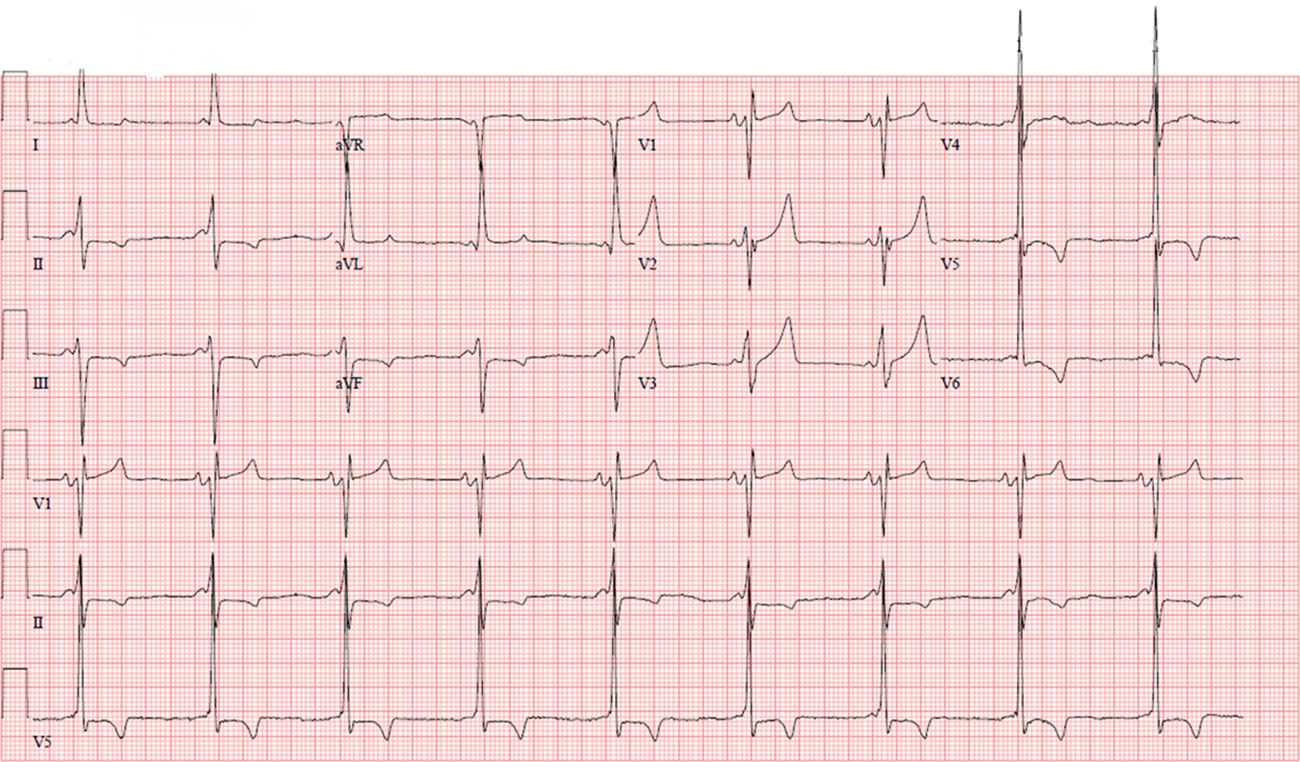
Figure 2: ECG With a Short P-R Interval, LVH With Strain Pattern, and TWI in the Lateral Leads. Courtesy of Umer M, Kalra D.
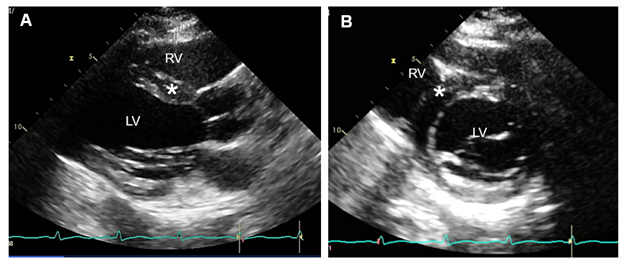
Figure 3: Transthoracic Echocardiogram. Courtesy of Umer M, Kalra D.
Figure 3
PLAX view (panel A) and PSAX view (panel B) showing normal LV size and mild increase (13 mm) in the basal anteroseptal wall thickness (asterisk).
LV = left ventricle; PLAX = parasternal long-axis; PSAX = parasternal short-axis; RV = right ventricle.
PLAX view (panel A) and PSAX view (panel B) showing normal LV size and mild increase (13 mm) in the basal anteroseptal wall thickness (asterisk).
LV = left ventricle; PLAX = parasternal long-axis; PSAX = parasternal short-axis; RV = right ventricle.
Which one of the following tests would most likely help make the correct diagnosis?
Show Answer
The correct answer is: C. Cardiovascular magnetic resonance (CMR) imaging and genetic testing for an infiltrative cardiomyopathy.
CMR imaging for infiltrative cardiomyopathy and genetic testing for suspected Fabry disease (FD) in a heterozygous female would be the most helpful test.
CMR showed mild asymmetric increase in wall thickness (basal-mid anteroseptal wall measuring 13 mm), LV mass (89 g/m2), and LVEF 58% with mild hypokinesis of the mid inferolateral wall (Video 1). Spin-lattice relaxation time (T1) parametric mapping showed mildly decreased native T1 relaxation time in the basal-mid anteroseptal wall (882 msec; reference value 984±18 msec for 1.5T scanner) and increased in the basal-mid inferolateral wall (1148 msec). Spin-spin relaxation time (T2) values were normal in the basal anteroseptal wall (48 msec; reference value 45±5 msec) and the basal inferolateral wall (49 msec). On late gadolinium enhancement (LGE) imaging, there was midmyocardial LGE in the basal-mid inferolateral wall (Figure 4). These findings were consistent with Fabry cardiomyopathy given the clinical context, and the diagnosis was confirmed by genetic testing showing a classic mutation (p.R363C).
Video 1: CMR Showing Mild Asymmetric Increase in Wall Thickness. Courtesy of Umer M, Kalra D.
CMR SSFP sequence short-axis cine showing a mild increase in the basal-mid septal thickness (~13 mm; asterisk) and mild hypokinesis of the LV basal and mid inferolateral walls (arrows).
CMR = cardiovascular magnetic resonance; LV = left ventricle; SSFP = steady-state free precession.
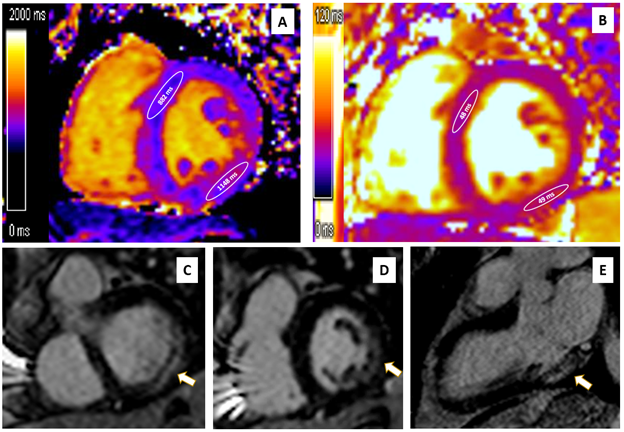
Figure 4: Midmyocardial LGE in the Basal-Mid Inferolateral Wall. Courtesy of Umer M, Kalra D.
Figure 4
(Panel A) CMR native T1 mapping showing low myocardial T1 value in the basal-mid anteroseptal wall (882 msec; reference value 984±18 msec for a 1.5T scanner), and high myocardial T1 values in the basal-mid inferolateral wall (1148 msec). (Panel B) Native T2 mapping showing normal myocardial T2 values in the basal anteroseptal wall (48 msec; reference value 45±5 msec) and the basal inferolateral wall (49 msec). (Panels C, D, E) Imaging showing midmyocardial LGE in the basal-mid inferolateral wall (arrows).
CMR = cardiovascular magnetic resonance; LGE = late gadolinium enhancement; T1 = spin-lattice relaxation time; T2 = spin-spin relaxation time.
FD is a rare, progressive, X-linked disorder caused by a deficiency of alpha-galactosidase A (α-GAL) enzyme. This deficiency leads to the accumulation of the sphingolipid globotriaosylceramide (GL3) within lysosomes, primarily affecting the CV, renal, and nervous systems. Males are obligatory hemizygotes and develop classic symptoms in childhood because of severely deficient α-GAL enzyme activity (typically <3%). Heterozygous females may have low-normal or variably deficient α-GAL activity and clinical manifestations depending on the underlying galactosidase alpha (GLA) mutation, residual enzyme activity, and random X-chromosome inactivation. In X-linked transmission, fathers pass on the mutation to all their daughters but to none of their sons, whereas there is a 50% chance for each boy or girl to inherit the mutation from their mother.
Early manifestations include angiokeratomas (which are seen in a swimming-trunk distribution [i.e., lower abdomen, back, and groin]) (Figure 1), neuropathic pain in the hands and feet (acroparesthesias [which this patient described]), cornea verticillata, and gastrointestinal tract symptoms, such as abdominal pain, diarrhea, and constipation.1 As the disease progresses, it can result in nephropathy and cardiomyopathy. CV disease is the most common cause of death, with life expectancy being shortened by approximately 25 years in untreated men and approximately 15 years in women. Proteinuria is an early manifestation due to glomerular deposition of GL3 and may be missed for many years before the usual markers of renal function (glomerular filtration rate or serum creatinine levels) are noted to be remarkable. Common cardiac manifestations include LV infiltration and increased wall thickness, heart failure with preserved ejection fraction (HFpEF), arrhythmias, microvascular angina, and premature myocardial infarctions. The ECG may show a short P-R interval (due to rapid atrioventricular nodal conduction from GL3 deposition), QRS and QT lengthening, and left ventricular hypertrophy (LVH). CMR can detect mild or subclinical cardiac phenotypes even before echocardiography or symptoms, especially in female patients without significant LVH using LGE and parametric mapping techniques.2 Midmyocardial LGE is present in almost one-half of patients and typically involves the basal and mid inferolateral myocardium in approximately 75% of these patients. Approximately one-fourth of females can develop LGE without LVH. Myocardial T1 values are reduced in the early stages (due to lipid accumulation), normalizing with progressive GL3 accumulation and ensuing interstitial fibrosis. In one study, mapping had a sensitivity of 48% and specificity of 99% in distinguishing patients with LVH-negative FD from healthy volunteers. In patients with LVH, T1 mapping can differentiate FD from other forms of hypertrophic cardiomyopathy (HCM). Reduced native T1 values are highly prevalent (89%) in patients with LVH-positive FD. Even in those with LVH-negative FD, almost 50% have reduced native myocardial T1 values. T2 values can be elevated in the early stages, which later corresponds to areas of LGE. Chronic T2 elevation in LGE areas and elevated global T2 values are associated with poor outcomes.3
Answer choice A is an incorrect choice because the diagnosis of FD is confirmed by enzyme activity assay and/or genetic testing; tissue biopsy is rarely required.4 This patient's clinical picture did not support myocarditis. In most US centers, genetic testing is the initial screening test due to its wide availability. Most genetic panels for cardiomyopathies featuring LVH can also rule out other potential etiologies, such as HCM or hereditary transthyretin amyloidosis; this clinical scenario does not support these alternate diagnoses. EMB is rarely used and is reserved for when giant cell or fulminant myocarditis is suspected, or rarely when a diagnostic dilemma persists after an initial workup of other infiltrative cardiomyopathies, such as cardiac amyloidosis or sarcoidosis.
Answer choices B and D are incorrect choices. She did not have symptoms or ECG changes concerning for CAD. Therefore, CCTA would likely have a low yield. FD vasculopathy is different from classic epicardial atherosclerosis. In the setting of FD, vascular cells accumulate GL3 from the circulation through the lipoprotein receptors. Severe microvascular dysfunction is the primary underlying mechanism for myocardial ischemia in the setting of FD. Myocardial perfusion decreases with disease progression, particularly in the subendocardium.5 CMR quantitative stress perfusion or cardiac positron emission tomography may be helpful in the assessment of coronary microvascular dysfunction if patients with FD have angina. Finally, whereas cardiac catheterization can help confirm the diagnosis of restrictive cardiomyopathy or constrictive physiology, noninvasive evaluation with echocardiography and CMR are usually the initial tests of choice and invasive evaluation is reserved for difficult cases when the diagnosis is not clear after these tests.
This patient had features of FD with involvement of the skin (angiokeratomas), nervous system (acroparesthesias), kidneys (proteinuria), and heart (LVH and HFpEF). Current guidelines recommend treatment in the presence of classic symptoms or signs with evidence of organ involvement by either imaging, laboratories, or histology (when needed). She was initiated on enzyme replacement therapy consisting of biweekly infusions of recombinant agalsidase-beta and her disease stabilized.
References
Umer M, Motwani M, Jefferies JL, Nagueh SF, Kalra DK. Cardiac involvement in Fabry disease and the role of multimodality imaging in diagnosis and disease monitoring. Curr Probl Cardiol 2023;48:[ePub ahead of print].
Umer M, Kalra DK. Cardiac MRI in Fabry disease. Front Cardiovasc Med 2023;9:[ePub ahead of print].
Augusto JB, Nordin S, Vijapurapu R, et al. Myocardial edema, myocyte injury, and disease severity in Fabry disease. Circ Cardiovasc Imaging 2020;13:[ePub ahead of print].
Madan N., Kalra D. Clinical evaluation of infiltrative cardiomyopathies resulting in heart failure with preserved ejection fraction. Rev Cardiovasc Med 2020;21:181-90.
Knott KD, Augusto JB, Nordin S, et al. Quantitative myocardial perfusion in Fabry disease. Circ Cardiovasc Imaging 2019;12:[ePub ahead of print].