A Temporary Squeeze: Recognizing the Paradigm Shift in Constrictive Pericarditis Management
A 77-year-old man with a history of hypertension, stage 3 chronic kidney disease, former tobacco use, ulcerative colitis status/post hemicolectomy treated with mesalamine, nonobstructive coronary artery disease, and an episode of acute viral pericarditis associated with a moderate pericardial effusion treated with a pericardial window 2 years earlier presents to the clinic for evaluation of shortness of breath. He is noted to have lower extremity swelling, abdominal distention, and extreme fatigue requiring the use of a wheelchair. He does not have concurrent chest pain.
Physical examination findings are notable for central adiposity with elevated jugular venous pressure (JVP) to the angle of the mandible, bibasilar crackles with decreased air entry bilaterally, significant abdominal distention, and 2+ peripheral edema to the knees bilaterally. Initial laboratory evaluation results include a negative troponin finding (<0.01 ng/mL), hemoglobin level 9.1 g/dL, and elevated high-sensitivity C-reactive protein level at 5.3 mg/L.
He undergoes a transthoracic echocardiogram with respirometer, with findings notable for left ventricular ejection fraction 65% with mildly dilated left atrial cavity, small pericardial effusion, right atrial tethering, abnormal septal bounce, and inferior vena cava plethora with minimal collapsibility. An echocardiogram shows no significant respiratory Doppler variation of the mitral inflow (18%) and tricuspid inflow (28%) (Figures 1, 2); however, there is borderline annulus reversus and prominent hepatic vein diastolic expiratory reversal compared with forward diastolic flow inspiration (Figure 3). Mitral annular tissue Doppler is shown in Figure 4.
Figure 1: Mitral Inflow View on Transthoracic Echocardiography. Courtesy of Sporn ZA, Klein AL.
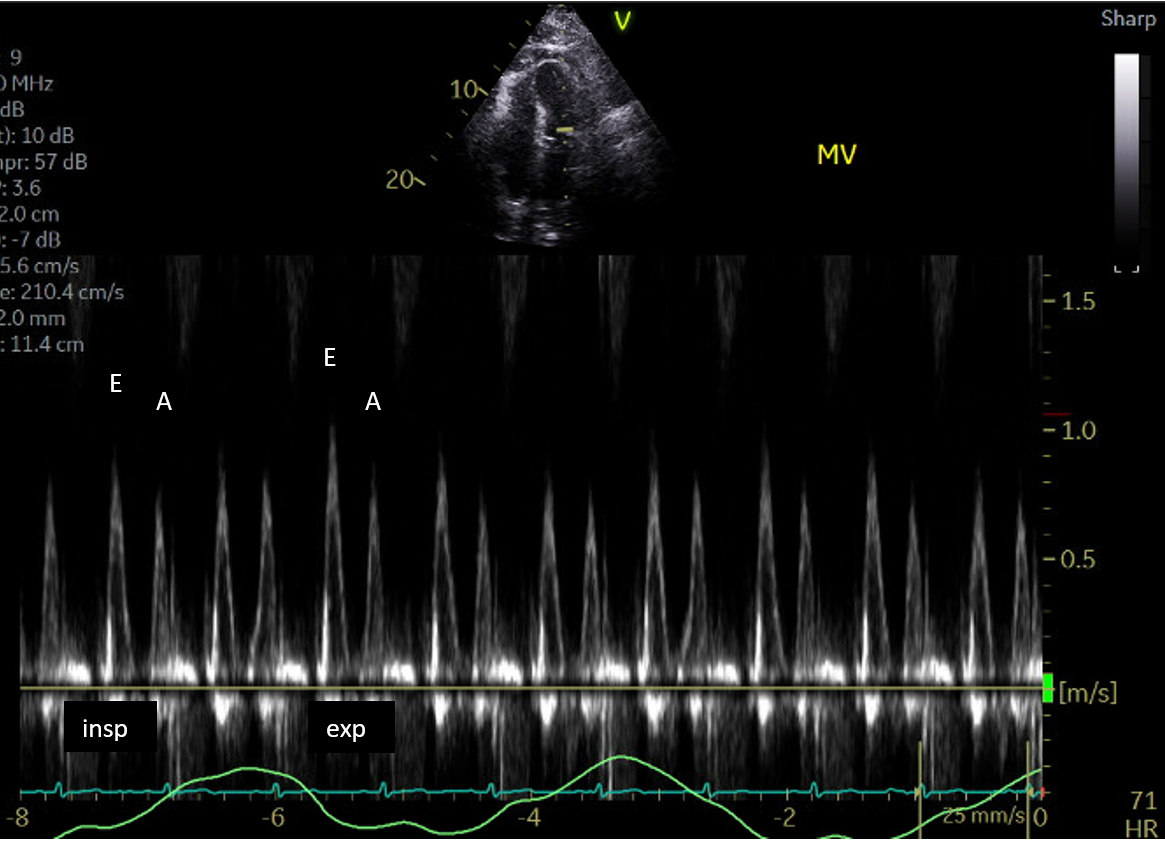
There is evidence of respiratory variation of 18% across the mitral valve.
Figure 2: Tricuspid Inflow View on Transthoracic Echocardiography. Courtesy of Sporn ZA, Klein AL.
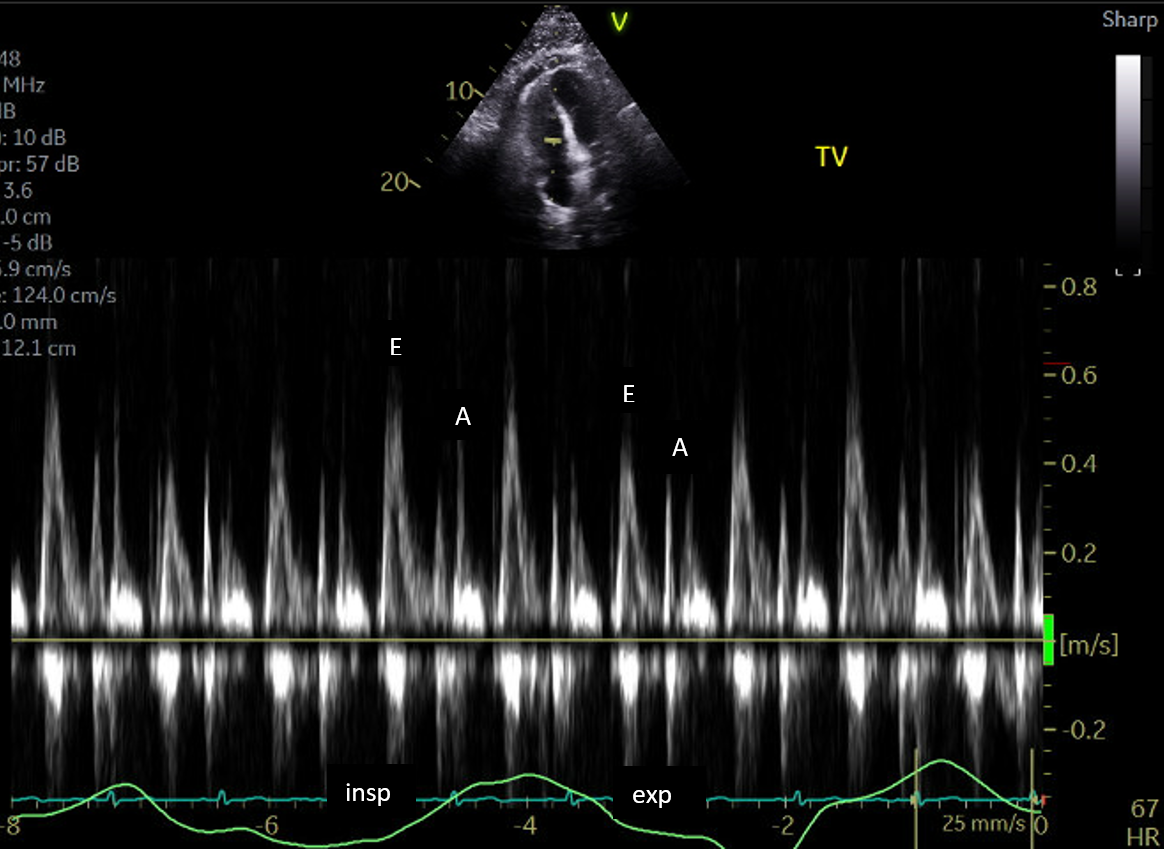
There is evidence of respiratory variation of 28% across the tricuspid valve.
Figure 3: Hepatic Flow Systolic and Diastolic Doppler Signals in a Patient With Similar Hepatic Venous Flow Velocities as the Present Patient. Courtesy of Sporn ZA, Klein AL.
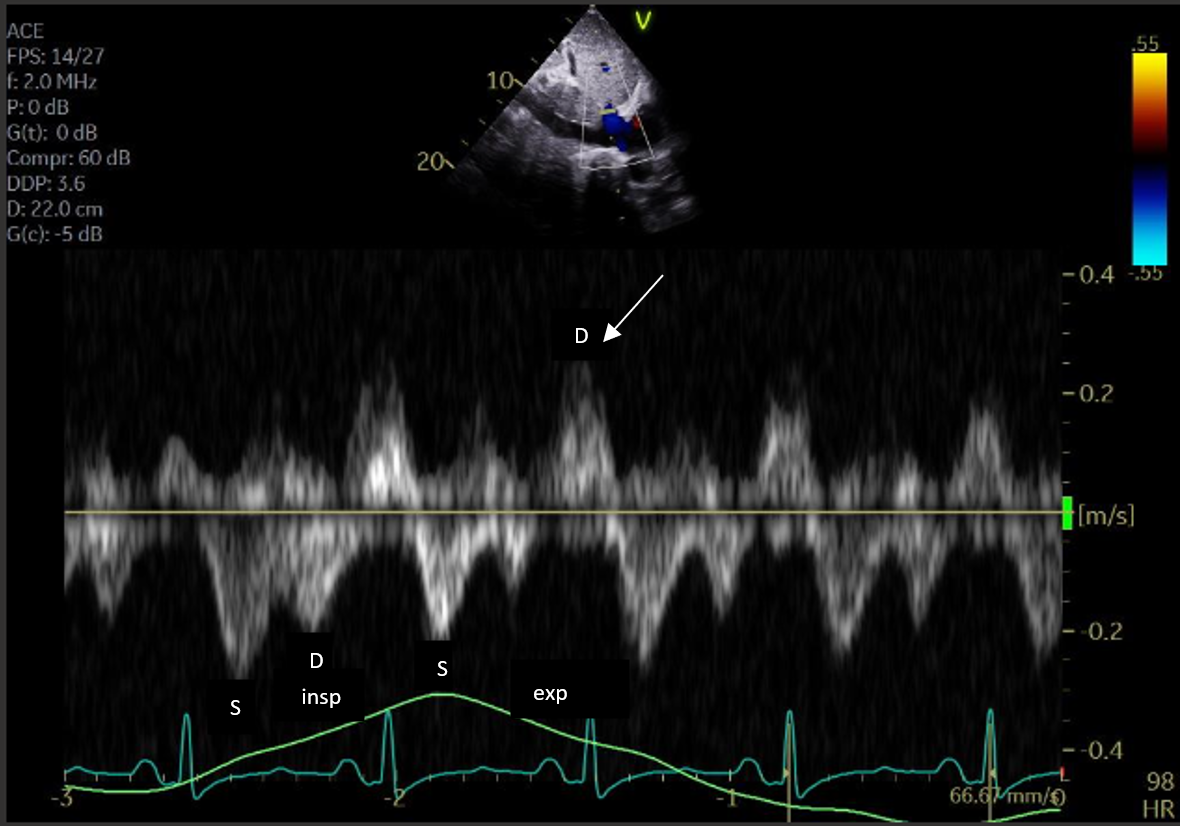
Flow below the zero baseline is toward the heart and above the baseline is reverse flow. On the first beat of expiration, there is diastolic flow reversal (arrow).
Figure 4: Mitral Annular Tissue Doppler on Transthoracic Echocardiography. Courtesy of Sporn ZA, Klein AL.
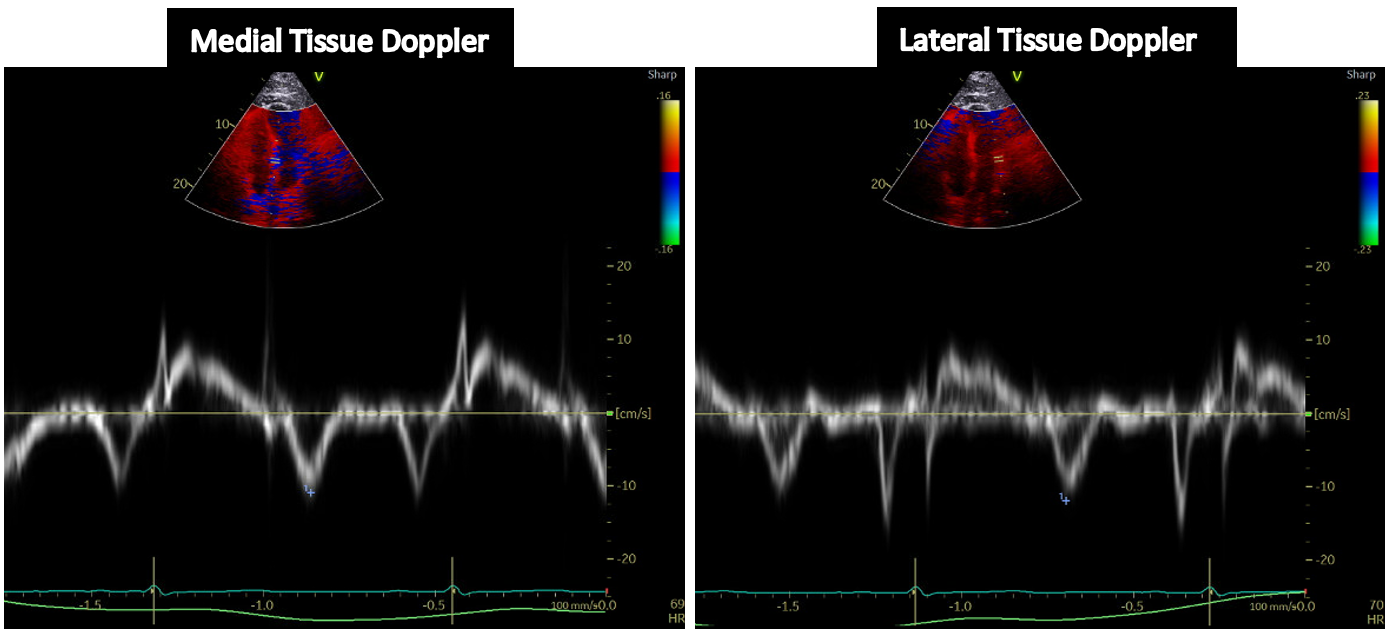
Medial mitral annular e′ velocity was 0.11 m/sec and lateral mitral annular e′ velocity was 0.11 m/sec.
Cardiac magnetic resonance imaging (MRI) shows mild pericardial thickening (3-4 mm), mild pericardial edema on spin-spin relaxation time–weighted imaging, and moderate pericardial late gadolinium enhancement (LGE) (Figures 5, 6, 7). There is constrictive physiology.
Figure 5: Cardiac Magnetic Resonance Imaging With Late Gadolinium Enhancement. Courtesy of Sporn ZA, Klein AL.
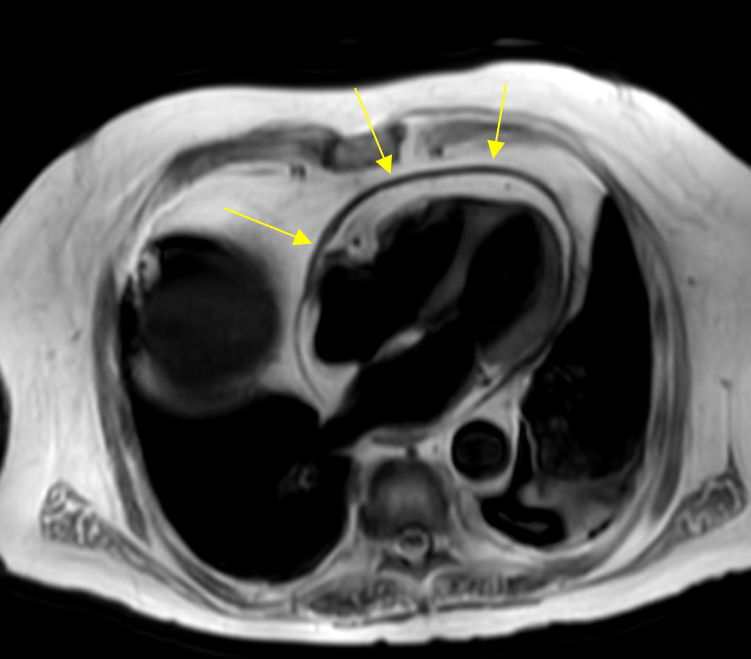
Yellow arrows indicate pericardial thickness.
Figure 6: Spin-Spin Relaxation Time–Weighted Imaging Showing Mild Pericardial Enhancement. Courtesy of Sporn ZA, Klein AL.
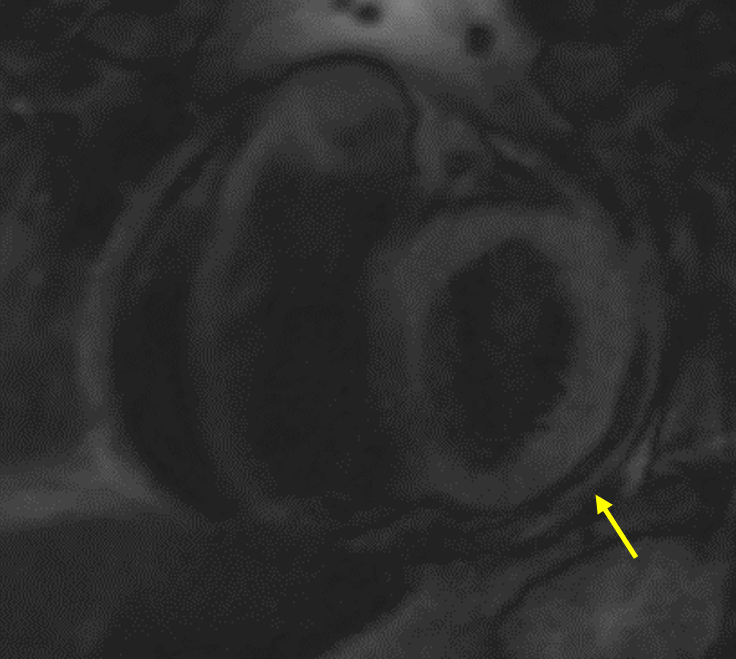
The arrow shows mild pericardial enhancement.
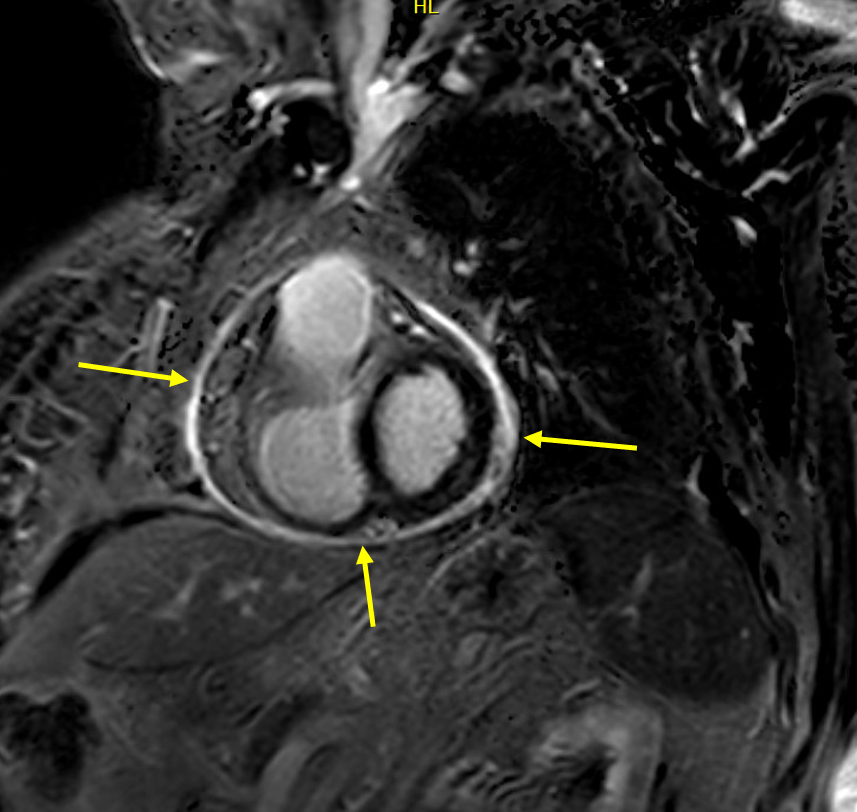
Figure 7: Late Gadolinium Enhancement on Cardiac Magnetic Resonance Imaging. Courtesy of Sporn ZA, Klein AL.
Which one of the following is the correct diagnosis for his clinical scenario?
Show Answer