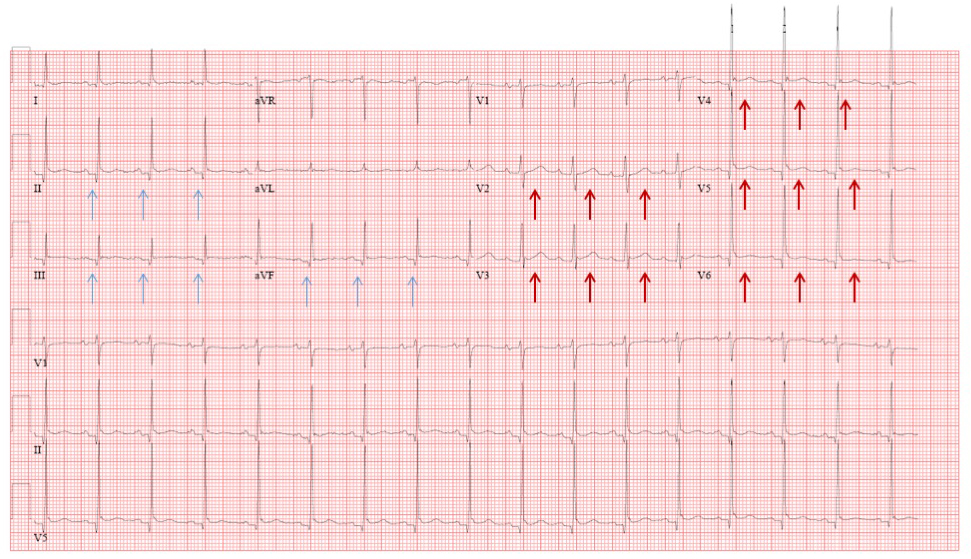
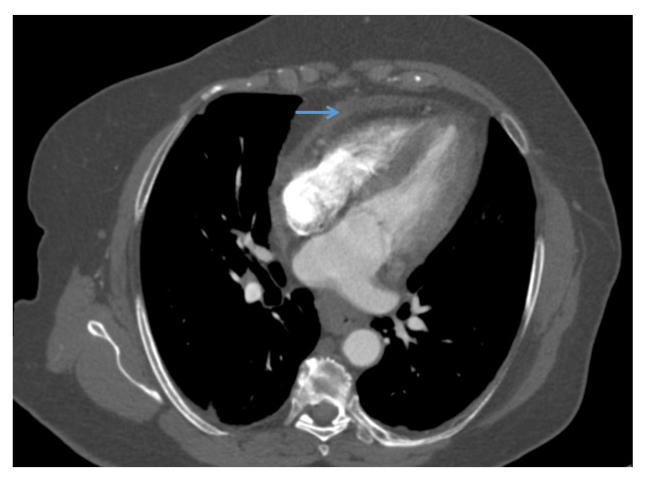
A 69-year-old female presents with low grade fever and chest pain that worsens with inspiration and lying on her left side. One month prior, she had undergone aortic valve replacement (AVR) and aortic root enlargement with autologous pericardium via a mini-thoracotomy. At her initial presentation in the emergency department, a 12-lead ECG was obtained showing mild ST elevation more prominent in the lateral pre-cordial leads and diffuse PR depression (Figure 1). Her chest x-ray showed trace right sided pleural effusion and a chest computed tomography to rule out pulmonary embolus (PE) showed no evidence of PE but revealed a small anterior pericardial effusion (Figure 2). Laboratory evaluation was significant for mild elevation in her C-reactive protein (CRP = 19.1mg/dL) and erythrocyte sedimentation rate (ESR = 67mm/hr). A high-sensitivity troponin was negative. A presumptive diagnosis of acute pericarditis was made and the patient was discharged home on colchicine 0.6mg PO BID, ibuprofen 600mg PO TID and omeprazole.
Figure 1
Figure 1: Twelve lead electrocardiogram showing subtle PR depression (blue arrows) and subtle ST elevation (red arrows).
Figure 2
Figure 2: Computed tomography of the chest to rule out pulmonary embolus demonstrated small anterior pericardial effusion (blue arrow).
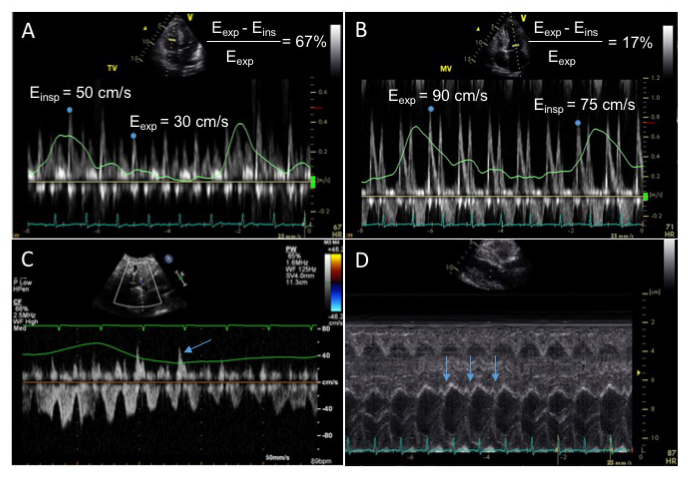
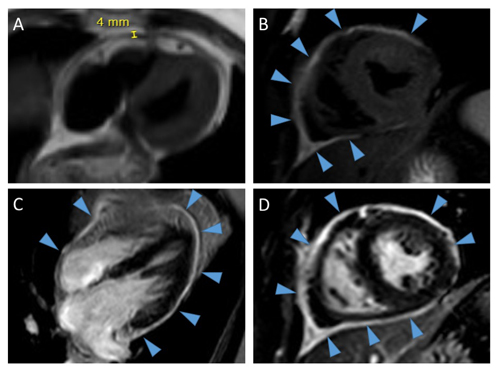
Two months later she presented with ongoing shortness of breath and chest pain as well as new onset pedal edema. She was still taking colchicine and ibuprofen as prescribed. Her inflammatory markers at this time remained mildly elevated, with a CRP = 7.2mg/dL and ESR = 47mm/hr. An echocardiogram was performed which demonstrated significant flow variation of 67% across the tricuspid valve (Figure 3a), an increase in diastolic flow reversal in the hepatic vein during expiration (Figure 3c) and an abnormal septal bounce (Video 1, Figure 3d). Cardiac magnetic resonance imaging (MRI) was performed which demonstrated mild pericardial thickening, small anterior pericardial effusion, increased signal intensity of T2 short tau inversion recovery (T2-STIR) imaging and severe circumferential pericardial delayed enhancement on fat-saturated delayed enhancement imaging (Figure 4a-d). There was also evidence of flattening of the interventricular septum with inspiration (Video 2).
Figure 3
Figure 3: Transthoracic echocardiography showing significant flow variation across the tricuspid valve (Panel A) and mild flow variation across the mitral valve (not meeting guideline cut off value of 25%) (Panel B). Continuous wave Doppler of the hepatic vein shows an increase in diastolic flow reversal during expiration (blue arrows in Panel C). M-mode through the interventricular septum from the parasternal long axis view shows a diastolic septal bounce (blue arrows in Panel D).
Video 1
Video 1: Transthoracic echocardiography showing an apical four chamber view demonstrating a subtle abnormal septal bounce.
Figure 4
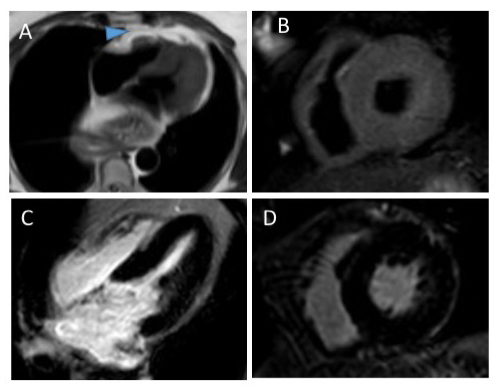
Figure 4: Cardiac magnetic resonance imaging demonstrating mild pericardial thickening on black blood imaging (Panel A), circumferential increased signal intensity on T2 short tau inversion recovery imaging suggesting pericardial edema (blue arrows heads in Panel B) and circumferential pericardial delayed enhancement on phase sensitive inversion recovery images (PSIR) (blue arrows heads in Panel C) and PSIR with fat suppression (blue arrows heads in Panel D).
Video 2
Video 2: Real time steady state free precession imaging demonstrates flattening of the interventricular septum with inspiration, suggesting the presence of constrictive physiology.
Which of the following is the next best step in management?
Show Answer
The correct answer is: B. Continue colchicine and ibuprofen and start oral prednisone.
This patient has post-pericardiotomy syndrome (PPS) following a mini-thoracotomy for AVR and aortic root enlargement with autologous pericardium. First diagnosed in 1953 in patients who developed fever and pleuritic pain following mitral valve surgery,1 PPS is an inflammatory pleuropericardial syndrome. The pathophysiology is thought to be immune mediated based on findings of elevated anti-heart antibodies, the latent onset of symptoms, and the response to anti-inflammatory treatment, however the exact pathophysiology is still incompletely understood.2 While open heart surgery is the most common cause, any injury to the pericardium, such as following radiofrequency ablation procedures or complications of percutaneous coronary intervention or pacemaker insertion, can be a trigger.2 The incidence ranges from between 9-50% depending on the populations studied.3 The diagnosis of PPS is made based on the presence of two of the following criteria: fever without explainable cause beyond the first post-operative week, pericardial friction rub, pleuritic chest pain, pericardial effusion or pleural effusion with elevated CRP. Our patient presented with four of these criteria, and thus fulfilled the criteria for PPS.
Similar to Dressler syndrome post myocardial infarction, common presenting symptoms of PPS include fever and pleuritic chest pain. In a prospective study of 360 patients enrolled for cardiac surgery, PPS was diagnosed in 15% of patients, 80% of whom were diagnosed within the first month of surgery and 20.4% in the second and third months.4 The most common symptoms were pleuritic chest pain (56%) and fever (54%) and the most common clinical findings included elevated inflammatory markers (74%), pericardial effusion (89%) and pleural effusion (93%). Risk factors for the development of PPS include female gender, younger age, prior pericarditis, aortic valve replacement, prior prednisone use and patients who received blood transfusion post operatively.4-6 Our patient had a typical presentation of PPS with symptoms of pleuritic chest pain and fever within one month of aortic valve surgery.
Medical therapy for PPS is similar to the treatment of acute pericarditis, and includes non-steroidal anti-inflammatory agents, colchicine and steroids. In a double-blind, placebo-controlled randomized controlled trial of 1019 adults undergoing cardiac operation, of whom 149 patients were diagnosed with PPS and enrolled in the study, ibuprofen and indomethacin were found to be 90% and 89% effective and significantly more effective than placebo (63%, p = 0.003).7 Up front steroid use in PPS is less well established, with one pediatric study showing no benefit of intravenous methylprednisolone in preventing PPS.8 Colchicine has been shown to be effective in preventing PPS. In a large randomized placebo controlled trial (COPPS), colchicine 1.0 mg twice daily on post op day 3 followed by a maintenance dose of 0.5 mg twice daily for 1 month in patients ≥70 kg (halved doses for patients <70 kg) significantly reduced the incidence of PPS at 12 months compared to placebo (8.9 vs. 21.1; p = 0.002) and also reduced secondary endpoints including disease-related hospitalizations, cardiac tamponade, constrictive pericarditis and recurrent pericarditis at 18 months.9 A second follow-up randomized controlled trial (COPPS-2 [COlchicine for Prevention of the Post-pericardiotomy Syndrome and Post-operative Atrial Fibrillation]) in which colchicine was given at the same dose, but 48-72 hours prior to surgery, similar reductions in PPS were demonstrated, though adverse outcomes occurred more commonly in the colchicine treated group.10 This highlights the importance of identifying high risk groups when considering preventative therapy.
The patient in this case was appropriately treated initially with colchicine and ibuprofen, however her symptoms did not resolve after 2 months of therapy. Her echocardiogram showed features of pericardial constriction with an abnormal septal bounce, significant flow variation across the tricuspid and mitral valves and expiratory diastolic flow reversal in the hepatic vein. A cardiac MRI demonstrated a small pericardial effusion, evidence of pericardial edema (increased signal intensity of T2-STIR imaging) and inflammation (circumferential late gadolinium enhancement) as well as signs of constrictive physiology, suggesting the presence of effusive-constrictive pericarditis. The presence of pericardial inflammation on cardiac MRI is helpful for the identification of patients with transient pericardial constriction that can be reversible with heightened anti-inflammatory treatment, which occurs in 10-20% of pericardial constriction cases.11 Therefore, given the patient's cardiac MRI findings, the correct answer in this case is to add corticosteroids to the patient's colchicine and ibuprofen (i.e. triple therapy).
Follow-Up
After 3 months of triple therapy with oral prednisone, starting at Prednisone 40mg PO daily with a slow taper, colchicine and ibuprofen, the patient's symptoms improved and her inflammatory markers normalized. A follow up cardiac MRI showed a reduction in the degree of pericardial delayed enhancement and no evidence of constrictive physiology (Figure 5 a-c).
Figure 5
Figure 5: Follow up cardiac magnetic resonance imaging demonstrating resolution of the previously seen pericardial thickening on black blood imaging, which shows that the pericardium is now a thin line (blue arrow head in Panel A). There has also been resolution of the previously seen increased signal on T2-short tau inversion recovery imaging, suggesting resolved pericardial edema (Panel B). There is no longer any pericardial delayed enhancement seen on phase sensitive inversion recovery images (PSIR) (Panel C) or on PSIR with fat suppression images (Panel D).
References
Janton OH, Golver RP, O'Neill TJ, Gregory JE, Froid GF. Results of the surgical treatment for mitral stenosis: analysis of 100 cases. Circulation 1952;6:321-33.
Imazio M. The post pericardiotomy syndrome. Curr Opin Pulm Med 2012;18:366-74.
Tamarappoo BK, Klein AL. Post-pericardiotomy syndrome. Curr Cardiol Rep. 2016;18:116.
Imazio M, Brucato A, Rovere ME, et al. Contemporary features, risk factors, and prognosis of the postpericardiotomy syndrome. Am J Cardiol 2011;108:1183-7.
Miller RH, Horneffer PJ, Gardner TJ, Rykiel MF, Pearson TA. The epidemiology of the postpericardiotomy syndrome: a common complication of cardiac surgery. Am Heart J 1988;116:1323-9.
Jaworska-Wilczynska M, Magalska A, Piwocka K, et al. Low Interleukin-8 level predicts the occurrence of the post pericardiotomy syndrome. PLOS One 2014;9:1-8.
Horneffer PJ, Miller RH, Pearson TA, Rykiel MF, Reitz BA, Gardner TJ. The effective treatment of postpericardiotomy syndrome after cardiac operations: a randomized placebo-controlled trial. J Thorac Cardiovasc Surg 1990;100:292-6.
Mott AR, Fraser CD Jr, Kusnoor AV, et al. The effect of short-term prophylactic methylprednisolone on the incidence and severity of postpericardiotomy syndrome in children undergoing cardiac surgery with cardiopulmonary bypass. J Am Coll Cardiol 2001;37:1700-6.
Imazio M, Trinchero R, Brucato A, et al. Colchicine for the Prevention of the Postpericardiotomy Syndrome (COPPS): a multicentre, randomized, double-blind, placebo-controlled trial. Eur Heart J 2010;31:2749-54.
Imazio M, Brucato A, Ferrazzi P, Pullara A, Adler Y, Barosi A, et al. Colchicine for Prevention of Postpericardiotomy Syndrome and Postoperative Atrial Fibrillation: the COPPS-2 randomized clinical trial. JAMA 2014;312:1016-23.
Cremer PC, Kumar A, Kontzias A, Tan CD, Rodriguez ER, Imazio M, Klein AL. Complicated pericarditis: understanding risk factor and pathophysiology to inform imaging and treatment. J Am Coll Cardiol 2016;68:2311-28.