A 52-year-old pediatrician with a past medical history of hyperlipidemia and remote tobacco use presented with pleuritic chest pain related to a viral prodrome. The patient stated that the pain was "pressure-like," radiated up to his neck, and was worse when he was supine. During a local ED evaluation, his ECG was remarkable for diffuse ST-elevations and elevated C-Reactive Protein (CRP) level of 43mg/dL. A 2D echocardiogram was normal. He was diagnosed with acute pericarditis, and was given 125mg methylprednisolone with subsequent symptom resolution.
2 months later, the patient had a relapse of symptoms and diagnostic workup showed an elevated CRP level (222 mg/dL). He was diagnosed with recurrent pericarditis and was started on NSAIDS, colchicine, and prednisone 5mg. A rapid weaning of steroid therapy was unsuccessful as it led to recurrent pain and shortness of breath. A CT scan was remarkable for pericardial thickening with enhancement, a small pericardial effusion, and bilateral pleural effusions. Based on these results, prednisone increased to 10mg, however symptoms persisted. On a follow-up visit, prednisone was increased to 60mg, ibuprofen 800mg three times a day, and colchicine 0.6mg twice a day, with rapid improvement in symptoms.
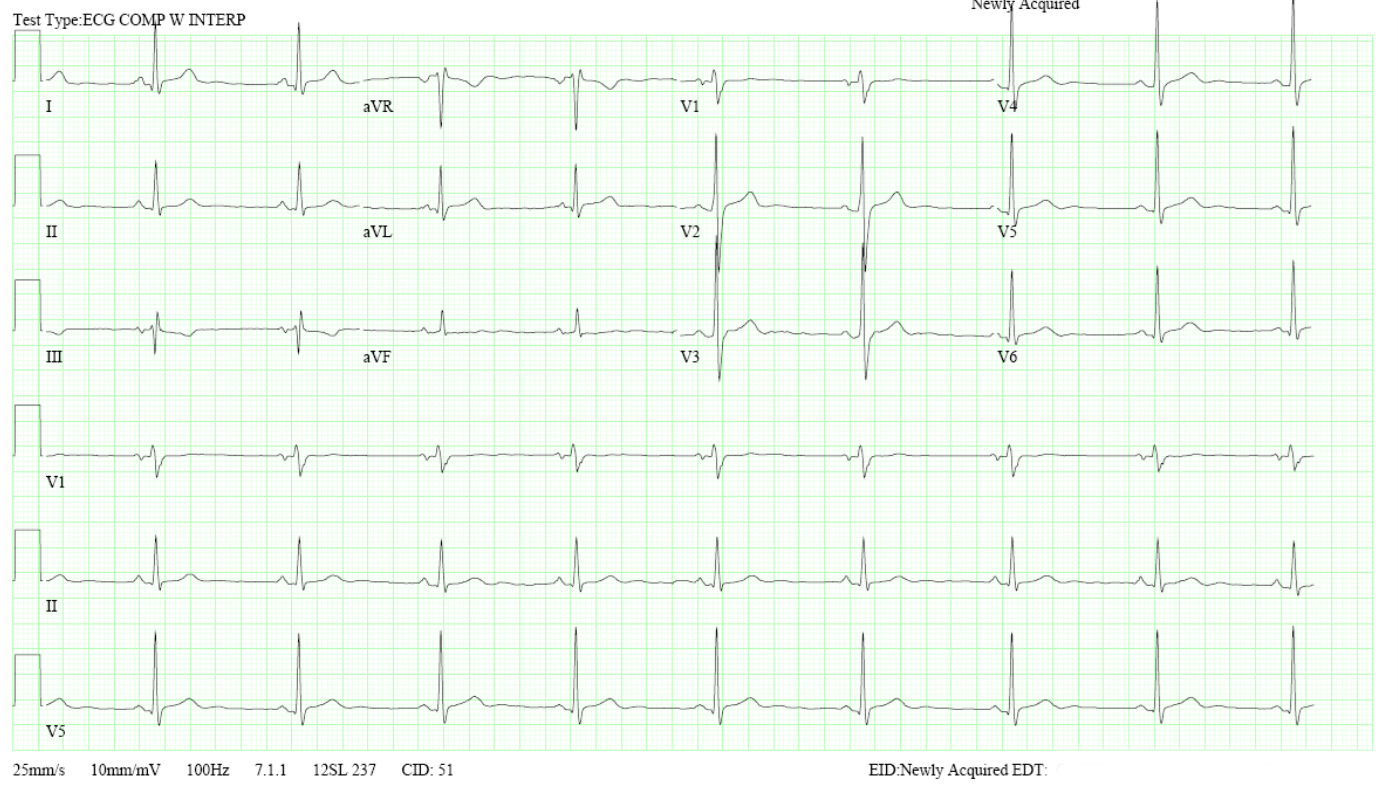
The patient then presented for outpatient follow-up. His vital signs were stable and physical exam was unremarkable. There was no jugular venous distension, no pericardial rubs, or murmurs. His ECG is demonstrated as Figure 1, revealing normal sinus rhythm and non-specific ST-T wave changes. Laboratory evaluation was remarkable for a mildly elevated ultrasensitive CRP 11.5mg/L, ESR 14mm/hr and elevated liver function tests (ALT 197 AST 42).
Figure 1: ECG demonstrating normal sinus rhythm with normal PR segment and nonspecific ST segment and T wave changes.
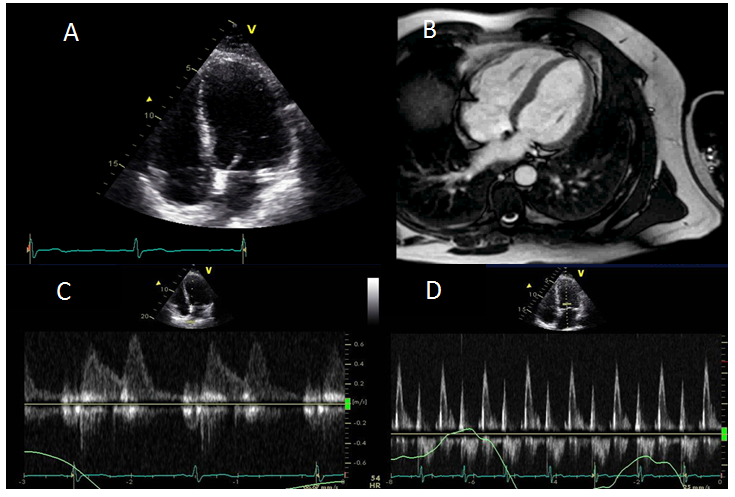
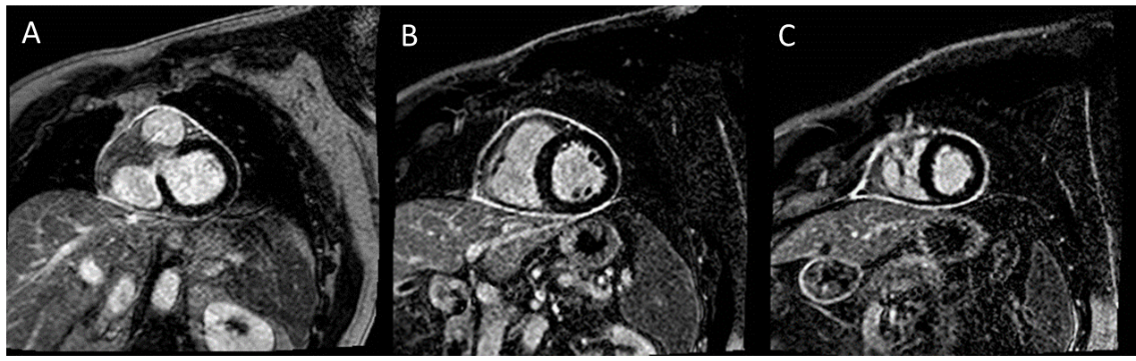
There were no echocardiographic or MRI evidence of pericardial constriction (Figure 2). An echocardiogram and cardiac MRI revealed ejection fraction of 57% without significant pericardial effusion or valvular abnormalities. Delayed enhancement imaging was remarkable for circumferential pericardial enhancement on both fat saturated and fat suppressed imaging; consistent with active pericardial inflammation (Figure 3).
Figure 2: Tiles A and B represent 2D echo and SSFP MRI cine demonstrating normal biventricular size and systolic function. Tile C depicts mitral inflow pattern with E<A. Tile D demonstrates no significant respiratory variation in mitral inflow velocities.
Figure 3: Tile A is a fat-saturated delayed enhancement image depicting circumferential pericardial enhancement. Tiles B-C are fat-suppressed delayed enhancement images also depicting circumferential pericardial enhancement. The overall findings are consistent with active pericardial inflammation.
Which of the following is the next best step in management?
Show Answer
The correct answer is: C. Taper steroids, start immunomodulatory alternative (e.g., Azathioprine).
The ESC guidelines from 2015 recommend acute sentinel episodes of pericarditis be treated with a regimen of aspirin, NSAIDS, and colchicine.1 The key difference from prior guidelines was the addition of colchicine to conventional anti-inflammatory therapies as first line treatment for first and subsequent recurrences of pericarditis, which was based on the COPPS (Colchicine for the Prevention of the Post-pericardiotomy Syndrome) trial.2
This patient was solely administered corticosteroids as first line therapy which has been attributed to higher incidences of recurrences and thus should be used as second line therapy in acute pericarditis unless there is a contraindication to other drugs (NSAIDS/aspirin and colchicine). The same treatment algorithm should be employed in recurrences as well.
The patient was treated appropriately during subsequent recurrences using triple therapy of NSAIDS/aspirin, colchicine, and corticosteroids. Despite being on appropriate triple therapy, ancillary tests (CRP and Cardiac MRI) suggest active pericardial inflammation. The best next step in the management of this patient would be to begin a third-line, steroid-sparing immunomodulating medication.
The latest guidelines also acknowledge and incorporate new therapeutic choices including alternative immunosuppressive therapies (azathioprine), intravenous immunoglobulins, and interleukin-1 antagonists (anakinra). Out of all the newest agents, azathioprine has been the most widely studied. In a retrospective review of 46 patients, Vianello reported stable, steroid-free remission in 58% of patients.3 It is important to note that azathioprine was used as a steroid-sparing long-term agent, not indicated for acute pericarditis. Anakinra is an IL-1 antagonist that was initially marketed to treat rheumatoid arthritis that has shown to be useful in recurrent pericarditis. In a systematic review of nine studies with a total of 34 patients (94% on steroids), all patients were steroid-free at a mean of 62 days. During the follow-up period of 28 months, 24% were relapse-free, and no serious side effects were reported.4 In a recent preliminary study of patients with steroid dependent or colchicine resistant recurrent pericarditis, anakinra reduced the incidence of recurrence when compared to placebo over a period of 14 months.5 However promising, data regarding new therapies is too sparse to be recommended as first- or second-line therapy, but can be helpful as third- line or steroid-sparing therapies.
Follow-up
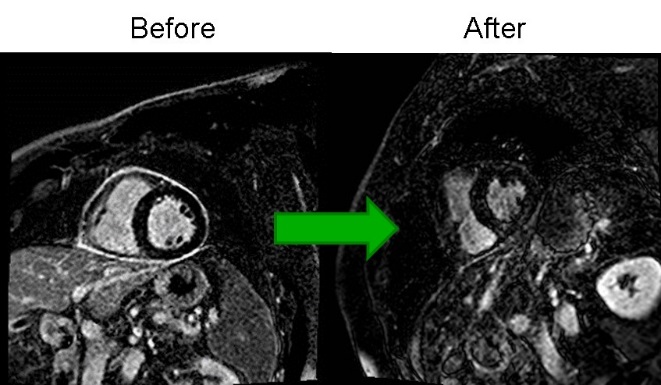
The patient was started on azathioprine as a steroid-sparing agent as corticosteroids were tapered. There were no further recurrences of chest pain and a repeat CRP dropped from 11.6 mg/L to 0.6mg/L, ESR dropped from 14-4 mm/Hr. On follow-up MRI (representative images below), there was marked improvement in pericardial enhancement to confirm that there was little to no active pericardial inflammation.
Figure 4: Follow-up MRI showing improvement in pericardial enhancement.
References
Adler Y, Charron P, Imazio M, et al. 2015 ESC guidelines for the diagnosis and management of pericardial diseases: the Task Force for the Diagnosis and Management of Pericardial Diseases of the European Society of Cardiology (ESC) endorsed by the European Association for Cardio-Thoracic Surgery (EACTS). Eur Heart J 2015;36:2921-64.
Imazio M, Trinchero R, Brucato A, et al. COlchicine for the Prevention of the Post-pericardiotomy Syndrome (COPPS): a multicentre, randomized, double-blind, placebo-controlled trial. Eur Heart J 2010;31:2749-54.
Vianello F, Cinetto F, Cavraro M, et al. Azathioprine in isolated recurrent pericarditis: a single centre experience. Int J Cardiol 2011;147:477-8.
Lazaros G, Imazio M, Brucato A, et al. Anakinra: an emerging option for refractory idiopathic recurrent pericarditis: a systematic review of published evidence. J Cardiovasc Med 2016;17:256-62.
Brucato A, Imazio M, Gattorno M, et al. Effect of anakinra on recurrent pericarditis among patients with colchicine resistance and corticosteroid dependence: the AIRTRIP randomized clinical trial. JAMA 2016;316:1906-12.