
Cardiopulmonary Exercise Testing in Athletes: Pearls and Pitfalls
Introduction
Cardiopulmonary exercise testing (CPET) has been a valuable tool in medicine and sports performance for decades. However, the intercept of the fields, particularly in consideration of the utility of CPET, is relatively new with the growth of sports cardiology. CPET in medicine is generally indicated in the evaluation of unexplained dyspnea and/or for stratification of patients for heart or lung transplants. In sports performance, CPET has been used to provide details and parameters for the athlete to improve training and human performance. With the promotion of CPET in sports cardiology, it is now not uncommon to see an athlete performing exercise testing in the same lab as those patients undergoing heart transplant evaluations. With some athletes capable of achieving maximal oxygen uptake (VO2max) in excess of 60 ml/kg/min or greater than 140% of predicted, clinicians need to be aware of some fundamental differences in athletes that reflect normal physiology rather than a pathological response as would be encountered in patients with heart and lung disease.
Cardiac Output, Stroke Volume and Heart Rate
The VO2max that elite level endurance athletes can attain is usually well in excess of what is predicted for sedentary, age, and gender matched controls. From the Fick relationship, VO2 is the product of cardiac output (heart rate x stroke volume) and arterio-venous oxygen difference (a-vO2 difference). In normal individuals (including elite-level athletes) at sea-level, the primary limiting factor to VO2max is cardiac output (CO).1 Since maximum heart rate (HR) is determined by genetics, gender, and age, stroke volume is the primary variable responsible for augmentation in VO2max. Elite athletes are able to generate remarkably high stroke volumes by increasing end-diastolic volume owing to a compliant heart and a distensible pericardium.2
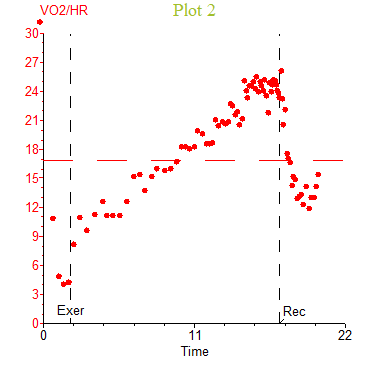
One of the most inviolate relationships in all of exercise physiology is between oxygen uptake and cardiac output. Regardless of age, gender, or the presence of various disease states, in general, about 5–6 L/min of cardiac output are required for every liter of oxygen uptake above rest.3 However, during a noninvasive CPET, cardiac output, stroke volume or a-vO2 difference are not directly measured. Since we can directly measure VO2 and HR, we can rearrange the Fick equation to VO2/HR = stroke volume x a-vO2 difference, which is often referred to as O2 pulse. In normal individuals at sea level, the a-vO2 difference is not considered the limiting factor to VO2 max; hence, changes in stroke volume can be inferred from O2 pulse. Critically, it must be remembered that while O2 pulse reflects changes in stroke volume, it is an indirect measure and actual stroke volume cannot be calculated from non-invasive data. In the general population, augmentation in stroke volume peaks around 50% of VO2max while the a-vO2 difference continues to increase resulting in a linear or curvilinear rise in O2 pulse. A plateau in O2 pulse with increasing work rate may suggest low or failing stroke volume in some patient populations. However, this may not hold true in elite athletes where the pattern of O2 pulse flattening has been demonstrated in up to 20% of elite soccer players.4 Figure 1 depicts an elite level triathlete without cardiovascular disease or symptoms performing an incremental bike test with a VO2peak of 59.6 ml/kg/min (144% predicted) and a flattening of the O2 pulse curve near maximal exercise. Importantly, this occurred well in excess of the predicted peak O2 pulse (151% predicted). Without associated electrocardiogram (ECG) changes and/or abnormal VO2/work slope, this likely reflects a plateau in VO2 near maximal exercise representing a true VO2max rather than the VO2peak often seen in ramp CPET protocols.
Figure 1
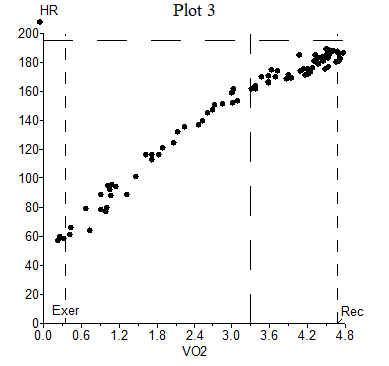
As mentioned above, maximum HR is predominately determined by age, gender, and genetics. However, data suggest that maximal HR in elite athletes is significantly lower than sedentary counterparts emphasizing the role of an enhanced stroke volume.5 A common calculation in many CPET labs is the metabolic chronotropic relationship or chronotropic index (CI) which relates HR reserve to the metabolic reserve at peak exercise (i.e., the slope of the relationship of HR to VO2): CI = [(peak HR – baseline HR)/(predicted peak HR – baseline HR)]/[(peak VO2 – baseline VO2)/(predicted peak VO2 – baseline VO2)]. In healthy subjects, the relationship between HR response and metabolic work should be approximately 1 (normal range 0.8-1.3), and a value of <0.8 is often considered consistent with chronotropic incompetence.6,7 In athletes, however, given the high VO2 peak obtainable with lower maximal HR compared to sedentary individuals, it is not uncommon to see a CI <0.80 (Figure 2). In exceptionally fit athletes (i.e., high VO2 peak and ventilatory anaerobic threshold), a low CI is usually not an abnormal finding.
Figure 2
Ventilation
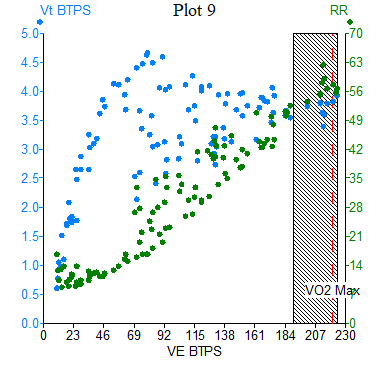
While lung capacity is not considered to be "trainable", many athletes have larger lung volumes than age matched controls.8,9 Thus, it is important that baseline spirometry be measured in athletes prior to CPET testing rather than using simple prediction equations. During exercise, athletes routinely generate tidal volumes and minute ventilation (VE) well in excess of what is typically seen in sedentary or minimally active patients with minute ventilation near or in excess of 200 L/min.10 If predicted rather than measured values of maximal voluntary ventilation (MVV), either directly measured or based on measured forced expiratory volume in 1 second, then many athletes may have breathing reserves ([MVV–VE]/MVV x100) close to zero percent or even negative. However, even when using appropriately measured MVV values, it is still not uncommon to see athletes with breathing reserves <10-15% coinciding with exceptional VO2 peak (Figure 3). Additionally, in the general population respiratory rate (RR) with maximal exercise tends to not rise above 50 breaths per min.11 However, elite athletes have demonstrated RR in the range 60-70 breaths per min (Figure 3).12 In an otherwise healthy athlete, these factors reflect an exceptional effort rather than maladaptive physiology.
Figure 3
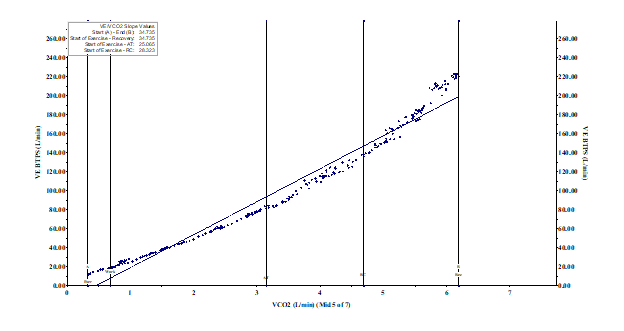
VE/VCO2 slope describes the efficiency of ventilation to remove CO2 during exercise with values typically <30 considered normal, but normative data can vary depending on how the slope is calculated.13 Many athletes have a pronounced hyperventilatory drive after the respiratory compensation pointe (RCP) as excess hydrogen ions accumulate that drive ventilation to maintain alveolar PO2 and subsequent arteriolar PO2. As such, the VE/VCO2 slope through end-exercise is not as reflective of ventilatory efficiency in those capable of exercising well above their RCP (Figure 4).14 In athletes with supramaximal VO2 peaks, VE/VCO2 slope through RCP or the VE/VCO2 nadir is preferred.
Figure 4
Exercise-Induced Arterial Hypoxemia (EIAH)
EIAH is defined as an absolute reduction in arterial oxygen saturation (SaO2) ≤95% (or 3% <rest) during exercise at or near sea level with desaturations ranging from 3-15% from resting values.15 This phenomena can be seen at or near maximal incremental exercise in approximately 50% of young, highly fit athletes and is more common with running than cycling with peak VO2 values in the range of 150-200% of predicted. The mechanism of EIAH is secondary to an excessive P(A-a)O2 (35-50mmHg) combined with a limited hyperventilatory response and acid pH-induced rightward shift of the Hgb-O2 curve. Etiologies remains unclear, although proposed mechanisms include inadequate hyperventilatory response due to low chemo-responsiveness, mechanical restraints of high ventilation, ventilation-perfusion inequality, failure of alveolar-end capillary diffusion equilibration due to rapid transit time of red blood cells in the lungs, and potential right-to-left shunting.16
Differentiating whether this process is a pathological versus a non-pathological response in an athlete undergoing CPET testing can be difficult. In general, a lack of overt symptoms with a supranormal exercise capacity, desaturation only near or at maximal exercise, normal VE/VCO2 slope or nadir, and a structurally normal appearing heart on imaging (or consistent with exercise-induced cardiac remodeling) suggest this to be a nonpathological phenomenon. Pathological causes such as primary lung disease, pulmonary embolism, and pulmonary hypertension would likely not be associated with supranormal exercise capacity. In addition, there would likely be additional supporting clinical data to suggest an underlying pathology. Exercise technicians and physicians must also be careful when interpreting possible EIAH, especially if obtained with a finger pulse oximeter and without clear evidence of a high-quality waveform.
Conclusion
CPET has become a valid and indispensable tool in the field of sports cardiology. It is also paramount to understand that there can be clinical situations in athletes, in which several basic CPET parameters may suggest cardiovascular disease, but in actuality are indicative of a healthy athletic finding. Understanding the basics of exercise physiology in athletes can bring important perspective in deciphering the meaning and significance of these parameters when deemed 'abnormal'. Care should be taken to interpret these findings, not in isolation, but in the context of a highly motivated, athletic individual with otherwise normal exercise physiology.
References
- Bassett DR Jr, Howley ET. Limiting factors for maximum oxygen uptake and determinants of endurance performance. Med Sci Sports Exerc 2000;32:70-84.
- Levine BD. VO2max: what do we know, and what do we still need to know? J Physiol 2008;586:25-34.
- Thompson PD. Exercise & Sports Cardiology. 1st ed.: McGraw-Hill Professional;2001.
- Perim RR, Signorelli GR, Myers J, Arena R, de Araújo CGS. The slope of the oxygen pulse curve does not depend on the maximal heart rate in elite soccer players. Clinics (Sao Paulo) 2011;66:829-35.
- Whyte GP, George K, Shave R, Middleton N, Nevill AM. Training induced changes in maximum heart rate. Int J Sports Med 2008;29:129-33.
- Brubaker PH, Kitzman DW. Chronotropic incompetence: causes, consequences, and management. Circulation 2011;123:1010-20.
- Gulati M, Shaw LJ, Thisted RA, Black HR, Bairey Merz CN, Arnsdorf MF. Heart rate response to exercise stress testing in asymptomatic women: the St. James women take heart project. Circulation 2010;122:130-37.
- Dempsey JA, La Gerche A, Hull JH. Is the healthy respiratory system built just right, overbuilt, or underbuilt to meet the demands imposed by exercise? J Appl Physiol 2020;129:1235-56.
- Durmic T, Lazovic Popovic B, Zlatkovic Svenda M, et al. The training type influence on male elite athletes' ventilatory function. BMJ Open Sport Exerc Med 2017;3:e000240.
- Hanson JS. Maximal exercise performance in members of the US Nordic Ski Team. J Appl Physiol 1973;35:592-95.
- Neder JA, Dal Corso S, Malaguti C, et al. The pattern and timing of breathing during incremental exercise: a normative study. Eur Respir J 2003;21:530-38.
- Wells GD, Norris SR. Assessment of physiological capacities of elite athletes & respiratory limitations to exercise performance. Paediatr Respir Rev 2009;10:91-98.
- Phillips DB, Collins SE, Stickland MK. Measurement and interpretation of exercise ventilatory efficiency. Front Physiol 2020;11:659.
- Neder JA, Berton DC, Arbex FF, et al. Physiological and clinical relevance of exercise ventilatory efficiency in COPD. Eur Respir J 2017;49:1602036.
- Dempsey JA, Wagner PD. Exercise-induced arterial hypoxemia. J Appl Physiol 1999;87:1997-2006.
- Dempsey JA, Sheel AW, Haverkamp HC, Babcock MA, Harms CA. [The John Sutton Lecture: CSEP, 2002]. Pulmonary system limitations to exercise in health. Can J Appl Physiol 2003;28 Suppl:S2-24.
Clinical Topics: Cardiac Surgery, Diabetes and Cardiometabolic Disease, Heart Failure and Cardiomyopathies, Invasive Cardiovascular Angiography and Intervention, Prevention, Pulmonary Hypertension and Venous Thromboembolism, Sports and Exercise Cardiology, Vascular Medicine, Cardiac Surgery and Heart Failure, Heart Transplant, Pulmonary Hypertension, Interventions and Vascular Medicine, Hypertension, Sports and Exercise and ECG and Stress Testing
Keywords: Sports, Athletes, Stroke Volume, Carbon Dioxide, Heart Rate, Maximal Voluntary Ventilation, Oxygen, Respiratory Rate, Hypertension, Pulmonary, Forced Expiratory Volume, Cardiovascular Diseases, Anaerobic Threshold, Reference Values, Healthy Volunteers, Exercise Tolerance, Ventricular Remodeling, Lung Volume Measurements, Electrocardiography, Spirometry, Athletic Performance, Lung Transplantation, Dyspnea, Perfusion, Medicine, Erythrocytes, Heart Transplantation, Pericardium, Pulmonary Embolism, Hydrogen-Ion Concentration, Exercise Test
< Back to Listings