Echocardiographic Evaluation of the Tricuspid Valve: A Quick and Updated Guide
Quick Takes
- Echocardiography remains a key tool to recognize and assess tricuspid regurgitation.
- Cardiologists will increasingly be required to evaluate the tricuspid valve, and this contemporary review offers nomenclature and tricks to obtain quality and comprehensive images.
Introduction
Tricuspid regurgitation (TR) is a common condition and its prevalence is only expected to increase with the aging population, rising rates of atrial fibrillation, and increased use of intracardiac devices (e.g., pacemakers).1 Multiple percutaneous strategies for treating TR are under investigation, including devices that improve leaflet coaptation, adjust annular geometry, or valve replacement, either within the annulus or heterotopically in the cavi.2 Regardless of the strategy, competence in the echocardiographic assessment of the tricuspid valve (TV) is crucial to diagnose the presence, severity, and etiology of TR, determine ideal treatment strategy and device candidacy, and support percutaneous interventions.
The prevalence and clinical impact of TR was largely overlooked until recently. A contemporary cohort showed 4.5% of the community and 12% of hospitalized patients had significant TR (equal to moderate or greater severity),3 which increased to 23% among patients with heart failure with reduced ejection fraction (HFrEF).4 Over 90% of TR is due to functional etiologies, including left-sided valvular disease, pulmonary hypertension, left ventricular (LV) dysfunction, or dilation of the tricuspid apparatus resulting in an incompetent valve.5,6 TR is associated with heart failure hospitalizations (RR 1.73)6 and all-cause mortality (RR 1.61 and 3.44 for moderate and severe TR, respectively).4,6,7
Echocardiography is an essential tool to assess the suitability of and support percutaneous interventions. New nomenclature was recently proposed to standardize planning and orchestrating percutaneous tricuspid valve interventions.8
Anatomy of the Tricuspid Valve
The TV typically has three leaflets: anterior (A), septal (S), and posterior (P).8,9 The relative circumferential length ratios of the A:S:P leaflets in healthy patients is 1:1:0.75; the anterior leaflet is the longest radially and most mobile while the septal leaflet is the shortest and least mobile.10,11 There is significant heterogeneity of the leaflet number where three (Type I, 54% of patients), four (Type III, 39%), two (Type II, 5%), or five leaflets (Type IV, 2%) are all described.8 Early work suggests clinical outcomes of percutaneous edge-to-edge repair between three- and four-leaflet configurations are similar.9 However, there are theoretical concerns of a wider coaptation gap, smaller leaflet grasping area, and more complex subvalvular apparatus in four-leaflet valves. Additionally, anatomical variants may generate complex regurgitant jets making intervention more challenging.12
Transthoracic Echocardiographic Assessment of the Tricuspid Valve
Current valvular guidelines recommend transthoracic echocardiography (TTE) to evaluate TR.13,14 Assessing right ventricle (RV) size and function, RV systolic pressure, right atrial (RA) size and estimated pressure, and left-sided heart disease are all important. Evaluation of the tricuspid annulus size, leaflet coaptation, and leaflet tethering and motion can help determine the etiology.5 The annulus is normally a saddle shape, but with dilation becomes flatter and more circular.5,10 Alternatively, leaflet malcoaptation may occur secondary to distortion of the papillary muscles and chordae in an elongated and dilated RV.5 Given the TV orientation, imaging all leaflets simultaneously with 2D transthoracic echocardiogram (TTE) is possible in only 5-10% of routine patients.15 Simultaneous leaflet visualization using 3D TTE can be achieved in 85-90% of patients at experienced centers.15 3D volume sets allow more for reproducible serial measurements that are more consistent with cardiac magnetic resonance imaging (CMR), but require further standardization of measurements prior to routine use.5,15
Transesophageal Echocardiographic Assessment of the Tricuspid Valve
Transesophageal echocardiography (TEE) allows for complementary images and is recommended to evaluate significant TR.13,14
Mid-esophageal View
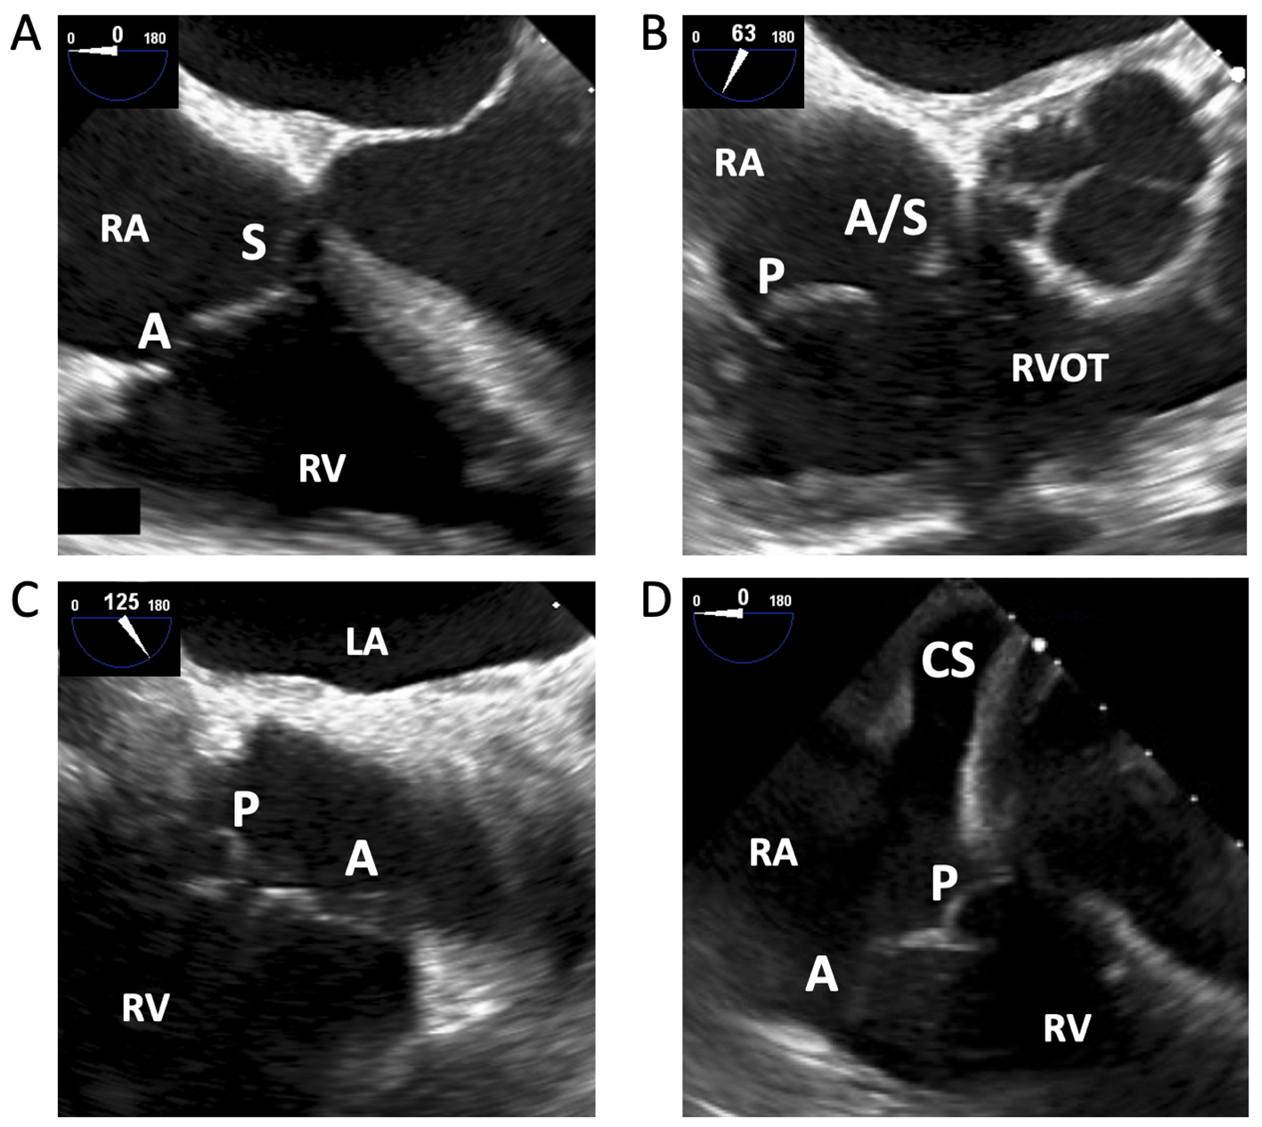
Using TEE, the first images of the TV are typically acquired in the mid-esophageal position. The tricuspid annulus and TEE imaging plane are rarely coaxial in this view, thus simultaneously imaging all leaflets is difficult.10 Additionally, compared to the mitral valve, TV leaflets are thinner and rarely calcify,16 making them less echogenic.15 In the four-chamber view, the A and S leaflets are typically in view (Figure 1A). Increasing the transducer angle to 60-70° brings in the RV inflow-outflow view (Figure 1B), and further increasing to 90-130° shows the A and P leaflets (Figure 1C). Withdrawing the probe reveals more anterior portions of the valve (more likely A and S), whereas advancing the probe shows the A and P leaflets, with the coronary sinus (CS) ostium as a useful landmark in the proximal field (Figure 1D). In this view, left-sided structures are removed from view and the TV to probe distance is minimized, making it useful for 3D image acquisitions.15 Biplane imaging can aid in correctly identifying leaflets.
Figure 1
Transgastric View
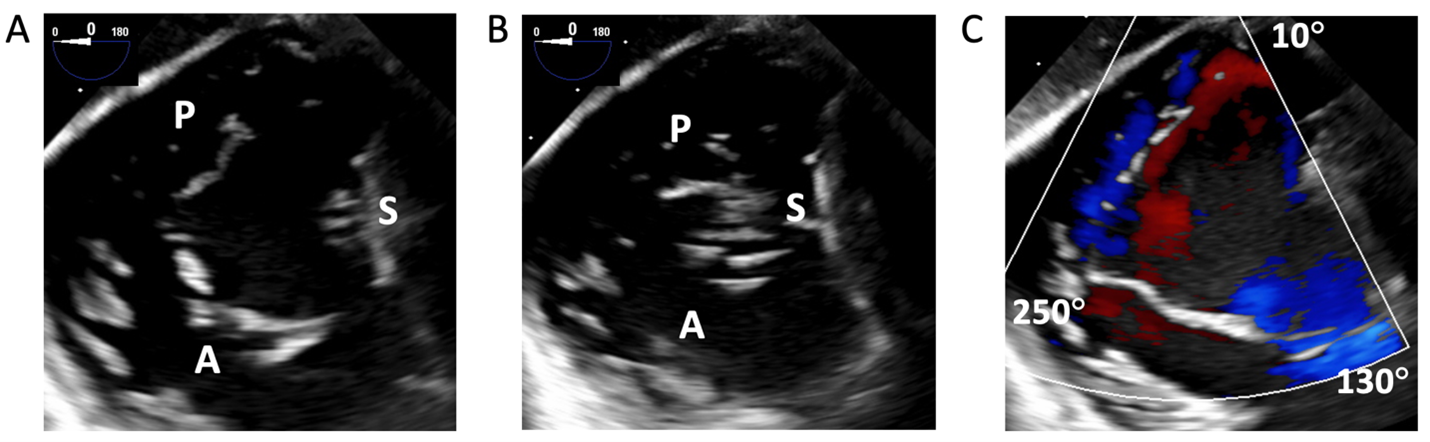
The transgastric, short-axis view of the TV annular plane is best to assess the leaflet position and number. Identify the anteroseptal commissure (adjacent to the aortic valve), septum, and the anterior papillary muscle by advancing and withdrawing the probe to help localize the leaflets. Increasing the transducer to 20-60°, the posteroseptal, anteroseptal, and anteroposterior commissures are usually found at 0°, 150°, and 240° and in three-leaflet valves, respectively (Figure 2).9 Color Doppler applied to 2D images helps in determining the presence and position of commissures (Figure 2B). Advancing the probe further to the deep gastric view with anteflexion with a transducer angled to 0-20°, an apical view of the TV can be acquired, which can be a prime location for Doppler evaluation.10
Figure 2
3D Images Acquisition
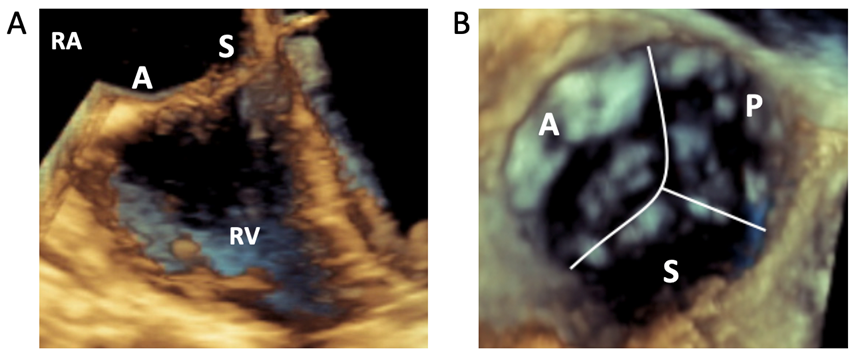
3D views may be helpful in defining leaflet anatomy. Visualization of the entire TV is possible in 65-70% of routine patients with TEE.15 3D images are ideally acquired when the leaflets are perpendicular to the beam. As such, the closed valve (during systole) may be better imaged in the deep esophageal view when leaflets are perpendicular to the insonation beam, whereas the open valve (in diastole) may be better imaged in the transgastric view. Real-time 3D can be useful to identify landmarks and for intraprocedural guidance (Figure 3A), but routine 3D volume sets allow for enhanced post-processing. The goal minimum temporal resolution is 20Hz for quantitative analysis.15 To achieve higher frame rates, use the smallest acquisition volume required and consider multi-beat acquisitions, particularly with a breath hold if intubated. Traditionally, 3D volumes were rotated to place the septal leaflet in the 6 o'clock position (Figure 3B).15
Figure 3
Grading Tricuspid Regurgitation Severity
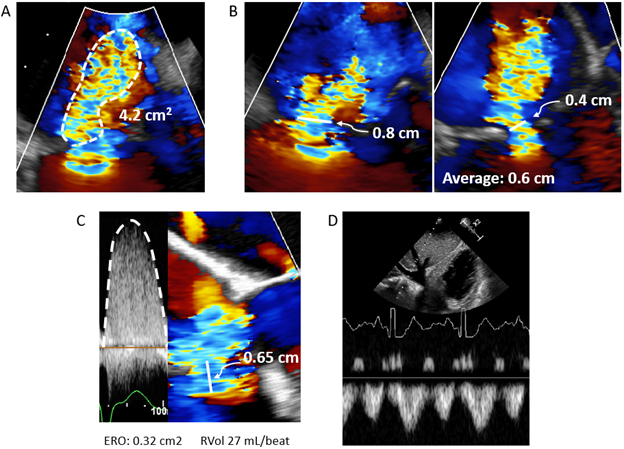
After defining the anatomy and etiology of TR, it is equally important to accurately grade the severity of regurgitation. TR severity is traditionally graded by jet area (Figure 4A), where severe TR is defined when the jet area ≥10 cm2 (with Nyquist limit 50 to 70 cm/sec).14 Jet area, even if not measured explicitly, is often qualitatively assessed by readers. However, jet area is influenced heavily by blood momentum (M = flow x velocity = area x velocity2), so regurgitant blood traveling through the same effective regurgitant orifice area (EROA) at twice the velocity will have four-times the area.17 As RV systolic pressure (RVSP) can be highly variable between patients, jet area alone can be misleading of TR severity. Additionally, regurgitant jets are often smaller if directed against a wall.
Vena contracta (VC), the narrowest width of the TR jet, is independent of driving pressure and is a useful semiquantitative measure of TR severity (severe ≥ 0.7 cm).14 Complex regurgitant jets (often ellipsoid or crescentic) combined with poor lateral resolution, as the TV is visualized as a distant structure in most views, makes this measure more challenging.17 As such, it is recommended that VC is measured as the average of two orthogonal (biplane) views (Figure 4B).17 For more geometrically complex jets, 3D VC area (VCA) may be useful. After acquiring 3D images as described above, VCA is measured by aligning two orthogonal planes parallel to the regurgitant jet. The third plane, which is now perpendicular to the jet, is adjusted to the level of the regurgitant orifice (the narrowest portion of the jet) and the VCA is traced (severe TR is VCA ≥ 0.75 cm2). However, complex jets are unlikely to be planer, so VCA may overestimate true regurgitant orifice area. Additionally, both VC and VCA will overestimate severity when TR is not holosystolic. Finally, the cutoff to define severe TR by VCA is not firmly established.17
Proximal isovelocity surface area (PISA) is a more quantitative technique for assessing TR severity. As regurgitant blood travels toward a narrow orifice, its velocity increases to peak at the narrowest area. This creates hemispheric shells on the upward side of the orifice where blood is traveling at the same velocity. By shifting the Nyquist limit (recommended to ~30 cm/sec), one can identify the location where blood crosses a specific velocity, va. The radius of this hemispheric shell (Figure 4C) is then used to calculate flow (Q = area x velocity = hemispheric surface area x va = 2πr2va). By the continuity equation, EROA is calculated as flow divided by peak velocity at the exact time when radius was measured, or Q/Vmax (severe TR ≥ 0.4 cm2).17 However, as the orifice is often complex and the shells may be non-hemispheric (particularly with functional TR with tethered leaflets), PISA may underestimate or overestimate TR severity, respectively. Additionally, non-holosystolic TR will also be overestimated by PISA. Non-holosystolic TR is better graded by calculating the regurgitant volume (RVol = EROA * TR velocity time integral), where severe TR is ≥45 mL/beat.14
Finally, TR severity may be estimated by comparing stroke volume to diastolic flow across the tricuspid annulus (RVol = diastolic flow – stroke volume). This is particularly useful with dynamic or complex regurgitant jets.17 Tricuspid annular area is most accurately measured using 3D planimetry, although annular diameters measured from biplane imaging or RV inflow and 4-chamber views with an ellipsoid area calculation may also be used. Pulsed wave Doppler at the level of the annulus with the measured annular area then gives diastolic flow through the TV, and stroke volume can be estimated by the LVOT (if no shunt) or RVOT method. Severe TR is ≥ 45 mL/beat.14
As each of the above methods has limitations, it is helpful to corroborate estimated TR severity with specific structural changes and spectral Doppler signals. First, the RV, RA, and IVC are typically dilated in chronic, severe TR. Second, severe TR is more likely with a dense, early-peaking, triangular envelope due to rapid pressure equilibration between the RV and RA; severe TR also typically has low peak velocity (generally <2.5 m/sec).17 Finally, pulsed wave spectral Doppler of the hepatic vein (Figure 4D) may show systolic reversal, but this finding may be misleading if the RA is small and non-compliant, or when right-sided filling pressure is elevated.17
Figure 4
Of note, a new grading scheme was proposed to further risk stratify severe TR into severe, massive, and torrential. As the recent valve guideline continued with severe TR alone,13 further stratification of severe TR at this point remains more useful for research purposes.
Echocardiographic Imaging during Percutaneous TV Interventions
Echocardiographic imaging during percutaneous interventions requires frequent and often repetitive transitions between views. For edge-to-edge repair, the transgastric view is helpful for clip orientation and positioning, whereas mid- and deep esophageal views are better to evaluate leaflet capture.15,18 3D images may further aid in confirming leaflet capture and device orientation and positioning. Most clips are placed between the A and S leaflets.19,20
Future Directions
With the high prevalence and morbidity of TR, many promising percutaneous approaches are being devised. Recent advances in imaging and standardization of nomenclature have allowed for better research and treatments for TR. As the evaluation of TR becomes standardized, more personalized and effective therapies will come to fruition.
References
- Zack CJ, Fender EA, Chandrashekar P, et al. National trends and outcomes in isolated tricuspid valve surgery. J Am Coll Cardiol 2017;70:2953-60.
- Asmarats L, Puri R, Latib A, Navia JL, Rodés-Cabau J. Transcatheter tricuspid valve interventions: landscape, challenges, and future directions. J Am Coll Cardiol 2018;71:2935-56.
- Chorin E, Rozenbaum Z, Topilsky Y, et al. Tricuspid regurgitation and long-term clinical outcomes. Eur Heart J Cardiovasc Imaging 2020;21:157-65.
- Benfari G, Antoine C, Miller WL, et al. Excess mortality associated with functional tricuspid regurgitation complicating heart failure with reduced ejection fraction. Circulation 2019;140:196-206.
- Badano LP, Hahn R, Rodriguez-Zanella H, Araiza Garaygordobil D, Ochoa-Jimenez RC, Muraru D. Morphological assessment of the tricuspid apparatus and grading regurgitation severity in patients with functional tricuspid regurgitation: thinking outside the box. JACC Cardiovasc Imaging 2019;12:652-64.
- Wang N, Fulcher J, Abeysuriya N, et al. Tricuspid regurgitation is associated with increased mortality independent of pulmonary pressures and right heart failure: a systematic review and meta-analysis. Eur Heart J 2019;40:476-84.
- Ren QW, Li XL, Fang J, et al. The prevalence, predictors, and prognosis of tricuspid regurgitation in stage B and C heart failure with preserved ejection fraction. ESC Heart Fail 2020;7:4051-60.
- Hahn RT, Weckbach LT, Noack T, et al. Proposal for a standard echocardiographic tricuspid valve nomenclature. JACC Cardiovasc Imaging 2021;14:1299-1305.
- Kitamura M, Kresoja KP, Besler C, et al. Impact of tricuspid valve morphology on clinical outcomes after transcatheter edge-to-edge repair. JACC Cardiovasc Interv 2021;14:1616-18.
- Hahn RT. State-of-the-art review of echocardiographic imaging in the evaluation and treatment of functional tricuspid regurgitation. Circ Cardiovasc Imaging 2016;9:1-15.
- Hahn RT, Abraham T, Adams MS, et al. Guidelines for performing a comprehensive transesophageal echocardiographic examination: recommendations from the American Society of Echocardiography and the Society of Cardiovascular Anesthesiologists. J Am Soc Echocardiogr 2013;26:921-64.
- Maisano F. Exploring the complexity of tricuspid valve anatomy: a further step toward understanding the no-more-forgotten valve. JACC Cardiovasc Imaging 2021;14:1306-08.
- Otto CM, Nishimura RA, Bonow RO, et al. 2020 ACC/AHA guideline for the management of patients with valvular heart disease: a report of the American College of Cardiology/American Heart Association Joint Committee on Clinical Practice Guidelines. J Am Coll Cardiol 2021;77:e25-e197.
- Zoghbi WA, Adams D, Bonow RO, et al. Recommendations for noninvasive evaluation of native valvular regurgitation: a report from the American Society of Echocardiography developed in collaboration with the Society for Cardiovascular Magnetic Resonance. J Am Soc Echocardiogr 2017;30:303-71.
- Muraru D, Hahn RT, Soliman OI, Faletra FF, Basso C, Badano LP. 3-dimensional echocardiography in imaging the tricuspid valve. JACC Cardiovasc Imaging 2019;12:500-15.
- Agricola E, Asmarats L, Maisano F, et al. Imaging for tricuspid valve repair and replacement. JACC Cardiovasc Imaging 2021;14:61-11.
- Hahn RT, Thomas JD, Khalique OK, Cavalcante JL, Praz F, Zoghbi WA. Imaging assessment of tricuspid regurgitation severity. JACC Cardiovasc Imaging 2019;12:469-90.
- Ro R, Tang GHL, Seetharam K, et al. Echocardiographic imaging for transcatheter tricuspid edge-to-edge repair. J Am Heart Assoc 2020;9:1-7.
- Nickenig G, Kowalski M, Hausleiter J, et al. Transcatheter treatment of severe tricuspid regurgitation with the edge-to-edge mitraclip technique. Circulation 2017;135:1802-14.
- Nickenig G, Weber M, Lurz P, et al. Transcatheter edge-to-edge repair for reduction of tricuspid regurgitation: 6-month outcomes of the TRILUMINATE single-arm study. Lancet 2019;394:2002-11.
Clinical Topics: Arrhythmias and Clinical EP, Cardiac Surgery, Cardiovascular Care Team, Diabetes and Cardiometabolic Disease, Geriatric Cardiology, Heart Failure and Cardiomyopathies, Noninvasive Imaging, Prevention, Pulmonary Hypertension and Venous Thromboembolism, Atrial Fibrillation/Supraventricular Arrhythmias, Aortic Surgery, Cardiac Surgery and Arrhythmias, Cardiac Surgery and Heart Failure, Acute Heart Failure, Pulmonary Hypertension, Echocardiography/Ultrasound, Magnetic Resonance Imaging, Hypertension
Keywords: Aged, Tricuspid Valve Insufficiency, Tricuspid Valve, Echocardiography, Transesophageal, Mitral Valve, Heart Failure, Papillary Muscles, Heart Ventricles, Atrial Fibrillation, Coronary Sinus, Hypertension, Pulmonary, Prevalence, Dilatation, Blood Pressure, Stroke Volume, Echocardiography, Magnetic Resonance Imaging, Aging, Transducers, Pacemaker, Artificial, Reference Standards, Hospitalization, Systole, Diastole, Breath Holding, Aortic Valve, Hepatic Veins, Motivation, Pulse Wave Analysis, Algorithms, Morbidity, Surgical Instruments
< Back to Listings