Computed Tomography Evaluation of Native Aortic Stenosis Beyond Calcification Score
Quick Takes
- The computed tomography (CT) aortic valve (AoV) calcification score is guideline endorsed to resolve ambiguity about aortic stenosis (AS) severity in patients with discordant echocardiographic measurements but ignores the contribution of fibrosis to the development of AS.
- Computed tomography angiography (CTA) might be the next iteration of CT assessment of the AoV, allowing precise delineation of AoV morphology and phenotyping and quantification of fibrotic and calcific leaflet thickening.
- AoV fibrocalcific volume derived from CTA provides a novel and complete assessment of AS severity, which can be of particular importance in women and in patients with bicuspid AoVs.
Echocardiography remains the principal imaging modality for detection and diagnosis of aortic stenosis (AS), as well as for grading of severity. It assesses valve hemodynamics on the basis of measurements of the aortic valve (AoV) peak velocity, mean gradient, and aortic valve area (AVA) estimated by the continuity equation. However, in up to one-third of patients, echocardiographic measurements are discordant, and the true severity of AS remains uncertain, with a potential delay in appropriate management and worse prognosis as a consequence.
The noncontrast computed tomography aortic valve calcification (CT-AVC) score has been validated as an ancillary measure to resolve ambiguity about AS severity and is supported by international guidelines to further direct clinical management of patients with discordant echocardiographic grading.1,2 The CT-AVC score provides an anatomical, flow-independent, quantitative measurement of valvular calcium and is suited for the prediction and tracking of disease progression.3 However, the CT-AVC score has important limitations, primarily related to the method of image acquisition. The unenhanced scan technique provides limited anatomical information about valve morphology and exact distribution of valvular calcium; measurements are performed in the axial plane without alignment in the valve plane; and fibrotic valve thickening, another important contributor to stenosis progression, cannot be assessed.
Fibrosis is particularly important in younger patients, women, and patients with bicuspid aortic valves (BAVs), in whom it often represents the dominant pathological component driving stenosis severity.4 In addition, fibrosis often precedes calcification, and detection and quantification of fibrosis may therefore allow for the identification of earlier disease stages that may be more amenable to therapeutic intervention. As such, there is a clear rationale for exploring alternative anatomical assessments of AS to overcome the aforementioned limitations, with contrast-enhanced computed tomography angiography (CTA) emerging as the next potential iteration of computed tomography (CT) assessment of the AoV (Figure 1).
Figure 1: Computed Tomographic Assessments of Patients With Native Aortic Stenosis
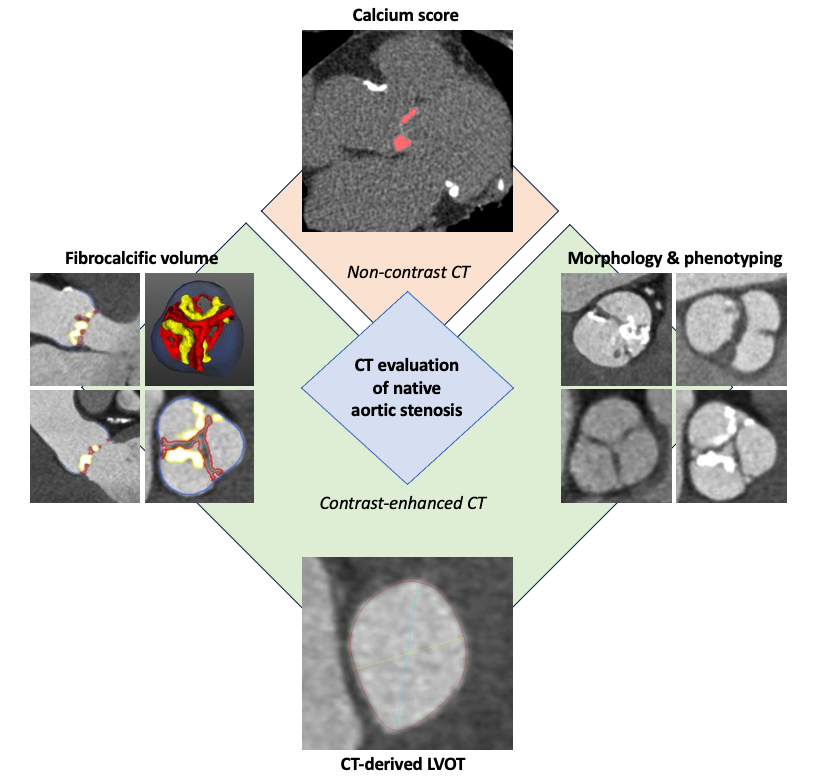
CT = computed tomography; LVOT = left ventricular outflow tract.
The administration of contrast provides greater anatomical definition, allowing precise delineation of AoV morphology and detection and phenotyping of BAVs. CTA also allows accurate detection and assessment of aortic dilatation or coarctation, pathologies that are often concomitant in patients with BAV, and assessment of associated coronary artery disease. CTA can also be used to measure AVA by direct planimetry or to obtain a hybrid AVA in which the left ventricular outflow tract area is measured by CT and velocities are measured by echocardiography.5 However, both types of CT-derived AVAs require different thresholds than those in standard AVA measurements by echocardiography and are less well studied.
However, the greatest advantage of the use of contrast-enhanced CT when evaluating patients with AS probably lies in its ability to assess and quantify the fibrotic leaflet thickening, a component that is overlooked by noncontrast CT-AVC. Cartlidge et al. first proposed a new method using CTA to measure both calcific and noncalcific leaflet thickening, which showed good correlation with disease severity on echocardiography and demonstrated that the noncalcific volumes relate principally to areas of valve fibrosis on histology.6 However, the investigators' proposed method was rather time-consuming and cumbersome, precluding translation into clinical practice. Quantitative analysis of AoV composition on preinterventional planning CTA images of 447 patients with AS who underwent transcatheter aortic valve implantation (TAVI) demonstrated improved diagnostic accuracy for stenosis severity and prediction of adverse events after TAVI when incorporating fibrotic quantification to calcification.7 Tissue components were identified on the basis of differences in CT attenuation and adjusted at the discretion of the expert reader, but consistent and robust attenuation thresholds to define calcific and noncalcific thickening were lacking.
Recently, a new technique was proposed that uses bespoke software with the integrated Gaussian mixture model that allows automatic identification of scan-specific Hounsfield unit thresholds for fibrotic and calcific tissue components (Figure 2).8 This method is quick, easy, and reproducible, and the obtained fibrocalcific volume correlated well with echocardiographic measures of stenosis severity and predicted disease progression at 1-year follow-up in a post hoc analysis of the SALTIRE II (Study Investigating the Effect of Drugs Used to Treat Osteoporosis on the Progression of Calcific Aortic Stenosis), which included 136 patients with calcific AS.8 The same method was used to examine the influence of cusp morphology on AoV composition in a cohort consisting of 70 patients with bicuspid AS and 70 with tricuspid AS, confirming the higher fibrotic volume in patients with bicuspid valves, especially in women,9 and reinforcing the importance of quantifying the fibrotic tissue component in the evaluation of AS severity in specific subpopulations. The next steps are to validate the technique on a wider scale and define fibrocalcific thresholds for severe AS, and an international multicenter study is currently underway.
Figure 2: Quantification of Fibrocalcific Volume From Computed Tomography Angiography
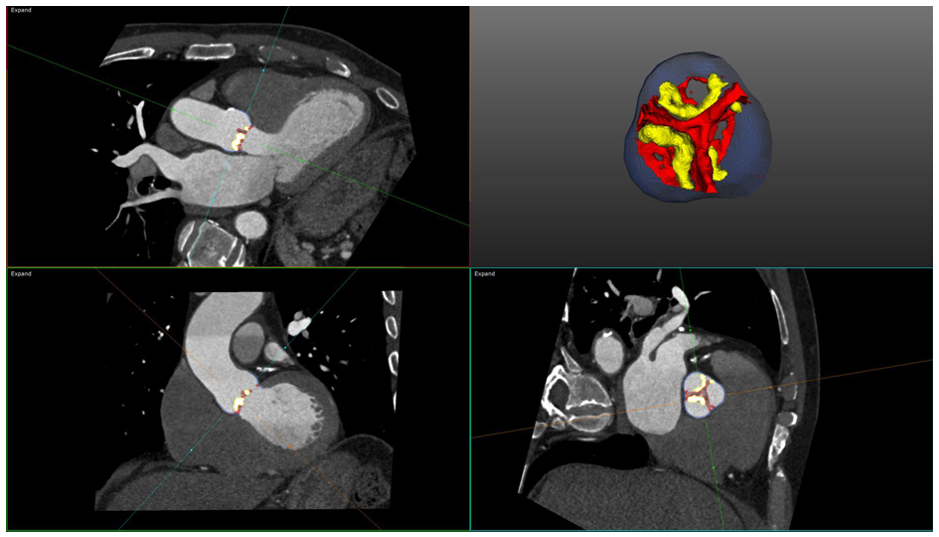
Fibrocalcific volume is measured using the AUTOPLAQ (ValveQuant module) software version 2.5 (Cedars-Sinai Medical Center, Los Angeles, California). Automated GMM-generated HU thresholds for the various subpopulations (fibrotic tissue, bloodpool, calcific tissue) within a 3D region of interest around the AoV are generated, allowing for volumetric quantification of fibrotic thickening (red) and calcification (yellow). In this case, the fibrotic volume was 247 mm3/cm2 and the calcific volume was 158 mm3/cm2, leading to fibrocalcific volume 405 mm3/cm2.
3D = three-dimensional; AoV = aortic valve; GMM = Gaussian mixture model; HU = Hounsfield unit.
References
- Vahanian A, Beyersdorf F, Praz F, et al.; ESC/EACTS Scientific Document Group. 2021 ESC/EACTS guidelines for the management of valvular heart disease. Eur Heart J 2022;43:561-632.
- Otto CM, Nishimura RA, Bonow RO, et al.; Writing Committee Members. 2020 ACC/AHA guideline for the management of patients with valvular heart disease: a report of the American College of Cardiology/American Heart Association Joint Committee on Clinical Practice Guidelines. J Am Coll Cardiol 2021;77:e25-e197.
- Pawade T, Clavel MA, Tribouilloy C, et al. Computed tomography aortic valve calcium scoring in patients with aortic stenosis. Circ Cardiovasc Imaging 2018;11:[ePub ahead of print].
- Voisine M, Hervault M, Shen M, et al. Age, sex, and valve phenotype differences in fibro‐calcific remodeling of calcified aortic valve. J Am Heart Assoc 2020;9:[ePub ahead of print].
- Ash J, Sandhu GS, Arriola-Montenegro J, et al. Performance of computed tomographic angiography–based aortic valve area for assessment of aortic stenosis. J Am Heart Assoc 2023;12:[ePub ahead of print].
- Cartlidge TR, Bing R, Kwiecinski J, et al. Contrast-enhanced computed tomography assessment of aortic stenosis. Heart 2021;107:1905-11.
- Grodecki K, Tamarappoo BK, Huczek Z, et al. Non-calcific aortic tissue quantified from computed tomography angiography improves diagnosis and prognostication of patients referred for transcatheter aortic valve implantation. Eur Heart J Cardiovasc Imaging 2021;22:626-35.
- Joshi S, Lembo M, Bing R, et al. 140 Fibrocalcific volume in aortic valve stenosis using contrast-enhanced computed tomography. Heart 2022;108:A106-8.
- Patel KP, Lin A, Kumar N, et al. Influence of cusp morphology and sex on quantitative valve composition in severe aortic stenosis. Eur Hear J Cardiovasc Imaging 2023;24:1653-60.
Clinical Topics: Cardiovascular Care Team, Invasive Cardiovascular Angiography and Intervention, Noninvasive Imaging, Valvular Heart Disease, Interventions and Imaging, Interventions and Structural Heart Disease, Computed Tomography, Nuclear Imaging
Keywords: Aortic Valve, Aortic Valve Stenosis, Computed Tomography Angiography