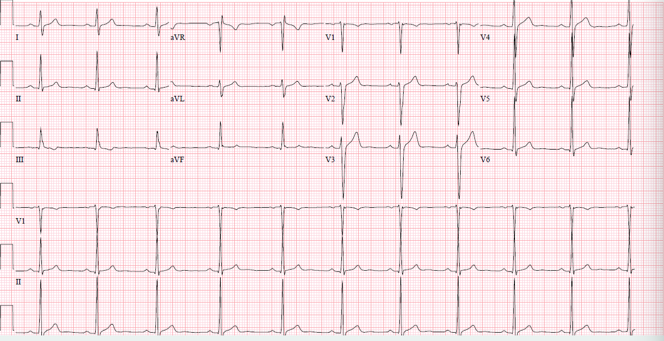
A 26-year-old male cyclist with no significant medical history was referred to a cardiologist for an evaluation of dyspnea. His training regimen consisted of ten hours of cycling per week with several maximum intensity rides and longer weekend rides lasting approximately four to five hours each. He recently noticed that he was having difficulty maintaining his pace with his fellow cyclists and was concerned that his exercise performance was declining. While he endorsed feeling better during exercise, he stated that he noticed a rapid, regular heart rate with pinching, focal chest discomfort at night during rest. After an unrevealing physical exam, a 12-lead ECG was obtained (Figure 1). He subsequently completed 24-hour ambulatory ECG monitoring which revealed sinus rhythm and rare pre-ventricular contractions without associated symptoms. At a time of reported "palpitations," his rhythm was normal sinus at 79 beats per minute.
Figure 1: Baseline electrocardiogram
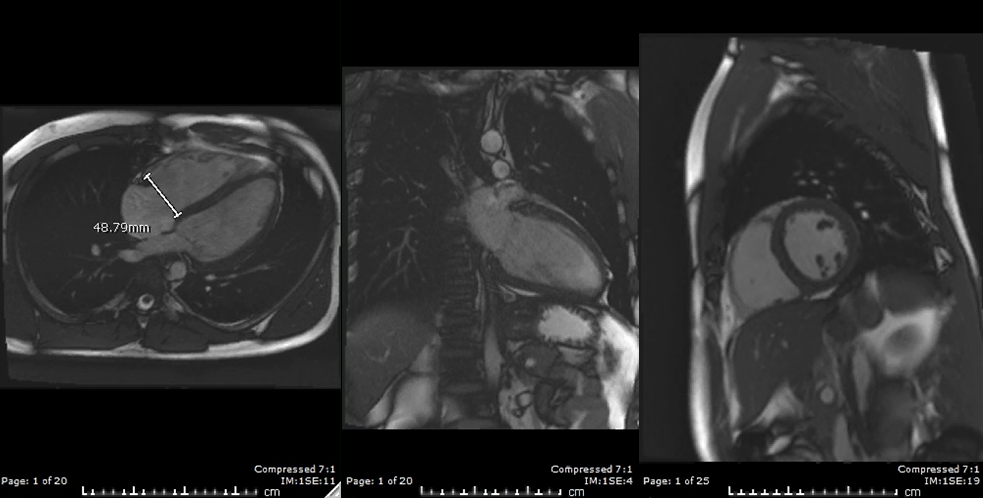
2-D transthoracic echocardiography was completed and reported normal left ventricular (LV) size (LVEDD 5.3cm) with LV systolic ejection fraction by Simpson's biplane method of 48% and normal LV diastolic filling pattern. Global longitudinal systolic strain (GLS) via 2D speckle tracking was suggestive of mildly reduced LV systolic function (GLS -16.9, Vendor GE). Right ventricular size and function were reported as normal and both atria were mildly dilated. Labs including a complete blood count, basic metabolic panel, cardiac biomarkers, thyroid function studies and iron studies were within normal limits. Acute phase reactants were collected and revealed a normal erythrocyte-sedimentation rate and mildly elevated C-reactive protein. A viral panel was obtained and showed elevated Coxsackie B and Echovirus titers. In addition, cardiac magnetic resonance imaging was completed (Figure 2).
Figure 2: Cardiac magnetic resonance imaging
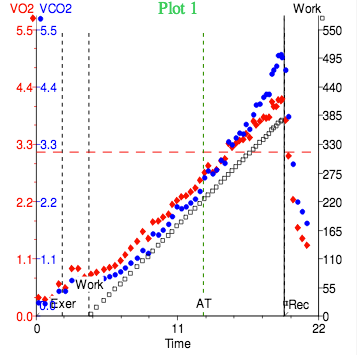
The patient completed a maximal 19 minute and 20 second cardiopulmonary exercise test via a 25-watt bike ramp protocol and achieved a VO2 max of 53.6 ml/kg/min (132% predicted) consistent with excellent physical conditioning. His O2 pulse was within normal limits (125% predicted). His normal VE/VCO2 slope of 25 and normal PETCO2 were indicative of normal pulmonary perfusion and ventilation-perfusion matching during exercise. He demonstrated a normal chronotropic response with exercise, achieving a maximum heart rate of 188 beats per minute (97% maximum predicted heart rate) and had appropriate augmentation of his blood pressure with exercise (resting blood pressure 140/96 mmHg, peak blood pressure with exercise 200/71 mmHg). He remained asymptomatic and in sinus rhythm throughout the study without evidence of ischemia or sustained arrhythmias (Figure 3).
Figure 3: Cardiopulmonary exercise testing
Which of the following is the most likely diagnosis?
Show Answer
The correct answer is: B. Clinical findings and cardiac imaging are consistent with exercise-induced cardiac remodeling.
Evaluating competitive athletes presenting with atypical symptoms can be difficult, particularly when initial testing is either unrevealing or could be suggestive of minor abnormalities versus exercise-induced cardiac remodeling (EICR). Multimodality imaging may be helpful in differentiating EICR from pathologic changes. When findings fall within a "gray zone," it is vital to differentiate from underlying structural cardiac abnormalities in athletes, as this conclusion may have implications on competitive sport participation.
The patient presented in this case had cardiac findings suggestive of borderline to mild left ventricular (LV) dilation and LV systolic impairment via traditional 2-D transthoracic echocardiography (TTE) and contemporary strain imaging. In contrast, his cardiac magnetic resonance imaging (CMRI) revealed normal LV systolic function with mild cavity dilation. Although his viral panel suggested recent or current infection, the lack of late gadolinium enhancement and edema in the myocardium makes myocarditis unlikely. Typical symptoms of myocarditis include exertional dyspnea and chest pain. CMR features of acute infection include epicardial or midmyocardial late gadolinium enhancement and enhanced water content on T2-weighted images. In a review of published controlled studies on CMR in myocarditis, the specificity of these combined tissue criteria being diagnostic of myocarditis was 95%.1 Dilated cardiomyopathy may also be present and typically resolves within 6 to 12 months. One of the most concerning sequelae of myocarditis is sudden cardiac death, occurring in 4% to 7.5% of athletes, predominantly males. Thus, the most recent AHA/ACC guidelines for competitive athletes with cardiovascular abnormalities recommend complete restriction of competitive sports participation until reimaging, within 3 to 6 months, shows normalization of ventricular systolic function and malignant arrhythmias are absent on Holter monitoring and exercise ECG.2
In this case, multiple cardiac imaging modalities demonstrated mild LV cavity dilation, which prompted the consideration of idiopathic dilated cardiomyopathy (IDCM) as the underlying diagnosis. To make the distinction between IDCM and EICR via imaging, physiologic LV dilation is oftentimes accompanied by right ventricular dilation and/or bi-atrial dilation with normal to low-normal systolic function in cases of benign EICR.3 Functional testing by way of cardiopulmonary exercise testing (CPET) can also help differentiate pathologic dilation from EICR by providing a direct measure of exercise capacity and left ventricular stroke volume (LVSV). If the O2 pulse, a surrogate for LVSV, is preserved, then LV cavity dilation with appropriate systolic augmentation during exercise is consistent with a diagnosis of EICR.
Given that this patient's ECG, ambulatory ECG monitoring, multimodality cardiac imaging studies, and functional assessment appeared most consistent with EICR, his atypical symptoms likely did not reflect an underlying cardiac abnormality. Thus, there was no indication for restriction from competitive sports participation or reason to repeat imaging at a later date.
References
Friedrich MG, Sechtem U, Schulz-Menger J, et al. Cardiovascular magnetic resonance in myocarditis: A JACC white paper. J Am Coll Cardiol 2009;53:1475-87.
Maron BJ, Udelson JE, Bonow RO, et al. Eligibility and disqualification recommendations for competitive athletes with cardiovascular abnormalities: task force 3: hypertrophic cardiomyopathy, arrhythmogenic right ventricular cardiomyopathy and other cardiomyopathies, and myocarditis: a scientific statement from the American Heart Association and American College of Cardiology. J Am Coll Cardiol 2015;66:2362-71.
Baggish AL, Battle RW, Beckerman JG, et al. Sports cardiology: core curriculum for providing cardiovascular care to competitive athletes and highly active people. J Am Coll Cardiol 2017;70:1902-18.