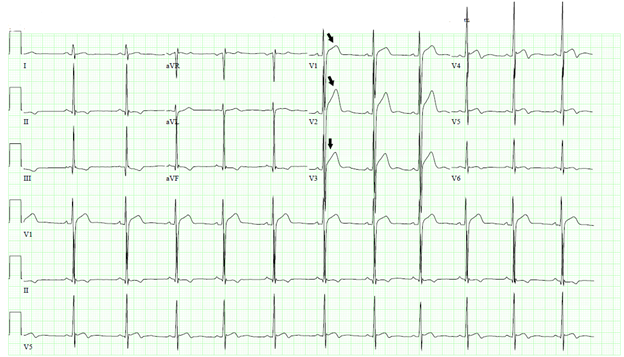
An 18-year-old African American male with recent SARS-CoV-2 infection (COVID-19) presented to our clinic for abnormal electrocardiogram (ECG) changes. He is a college football player and plays every day without any limitations. Two months ago, he developed fever of 100.9°F and headache. COVID-19 test was positive which was treated conservatively for 2 weeks at home. After recovery, he followed up with his primary care physician. He was asymptomatic with no complain of chest pain, shortness of breath, palpitations, dizziness, syncope, or lower extremity edema. He has no known family history of premature coronary artery disease or sudden cardiac death. ECG revealed ST segment elevation in leads V1-V3 (Figure 1) raising concern for COVID-19 pericarditis. He was prescribed indomethacin 50 mg three times a day and colchicine 0.6 mg twice a day. He was advised against return to play and referred to our pericardial clinic.
Figure 1
Figure 1
Figure 1: ECG depicting ST segment elevation in leads V1-V3.
Figure 1: ECG depicting ST segment elevation in leads V1-V3.
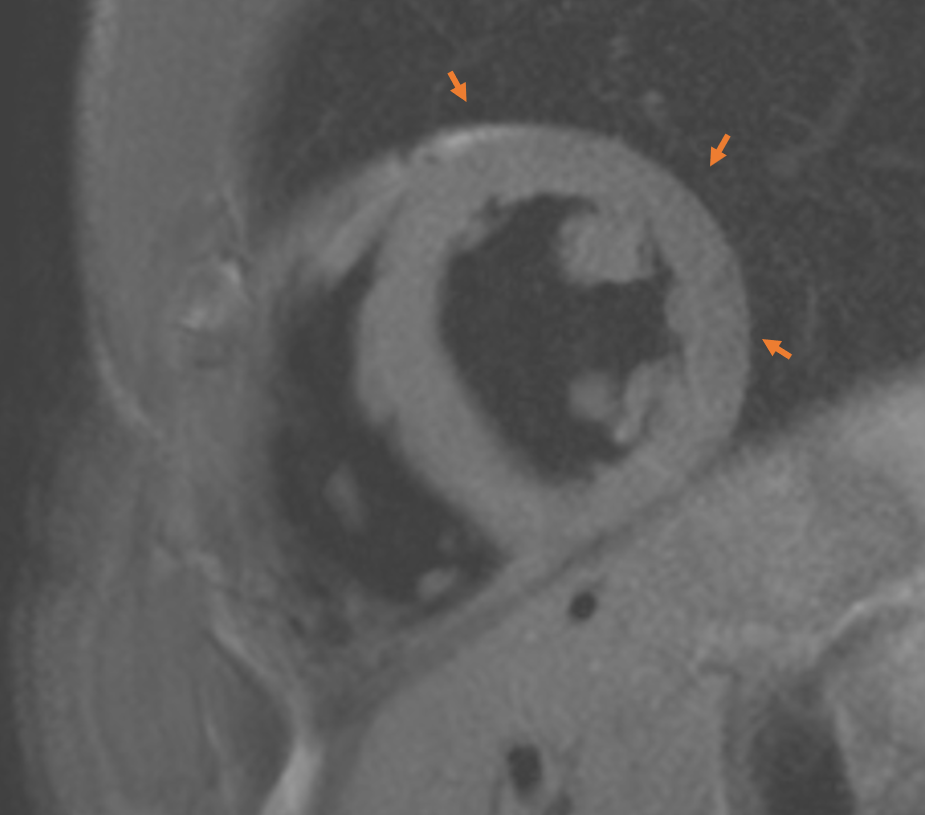
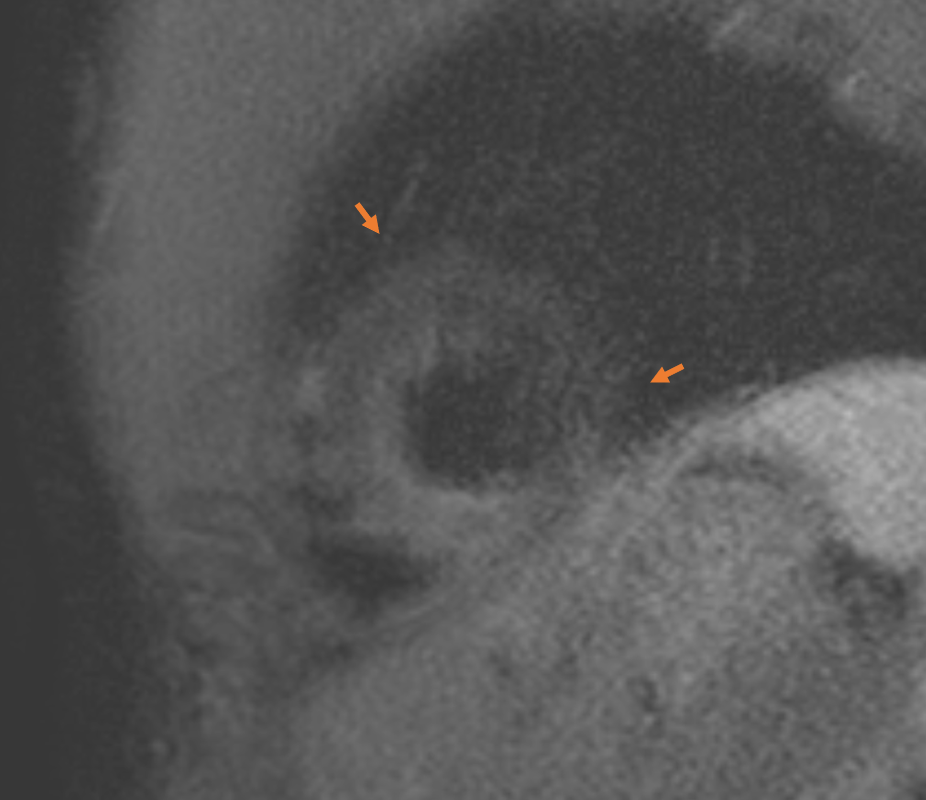
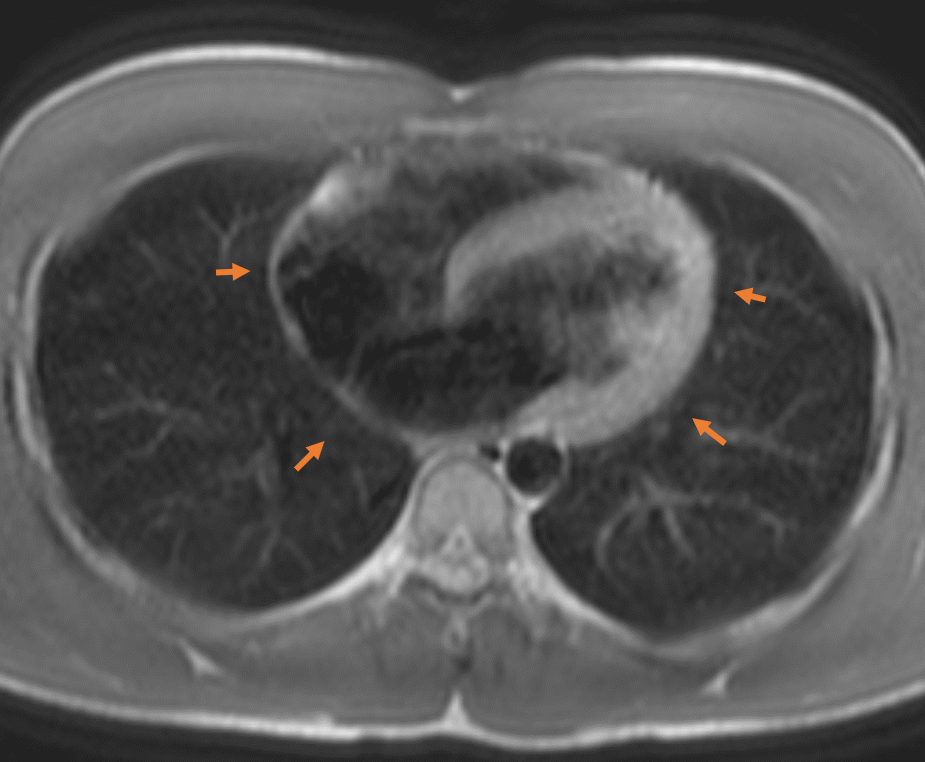
During evaluation at clinic, he appeared comfortable at rest without any acute complaints. Blood pressure was 110/68 mm Hg, heart rate 80 beats per minute, respiratory rate 12 breaths/minute with 100% oxygen saturation on room air and temperature 97.9°F. Physical examination revealed regular heart sounds with no audible murmurs or friction rub. Laboratory investigation revealed serum creatinine of 1.49 mg/dL (reference range: 0.73-1.22 mg/dL), troponin <0.01 ng/mL test results (reference range: 0.000-0.029 ng/mL), C-reactive protein (CRP) 0.5 mg/dL (reference range: <0.9 mg/dL) and erythrocyte sedimentation rate (ESR) 5 mm/hour (reference range: 0-15 mm/hour). Chest x-ray showed no pulmonary consolidation, pleural effusion, or cardiomegaly. Repeat ECG revealed persistent ST segment elevation in leads V1-V3. He underwent a transthoracic echocardiogram (TTE) showing normal biventricular function with an approximate ejection fraction of 60%. There was no pericardial effusion. Cardiac magnetic resonance imaging (CMR) revealed no thickening of pericardium, delayed enhancement, or pericardial edema. There was no evidence of constrictive physiology or myocardial inflammation to suggest myocarditis (Figure 2A-D).
Figure 2A
Figure 2A
Figure 2A: T2 Turbo spin echo (TSE) imaging demonstrating no increased pericardial signal suggestive of pericardial edema.
Figure 2A: T2 Turbo spin echo (TSE) imaging demonstrating no increased pericardial signal suggestive of pericardial edema.
Figure 2B
Figure 2B
Figure 2B: T2 Short TI inversion recovery (STIR) image showing on pericardial edema.
Figure 2B: T2 Short TI inversion recovery (STIR) image showing on pericardial edema.
Figure 2C
Figure 2C
Figure 2C: Black blood sequence axial slice showing no evidence of pericardial thickening or effusion.
Figure 2C: Black blood sequence axial slice showing no evidence of pericardial thickening or effusion.
Figure 2D
Figure 2D
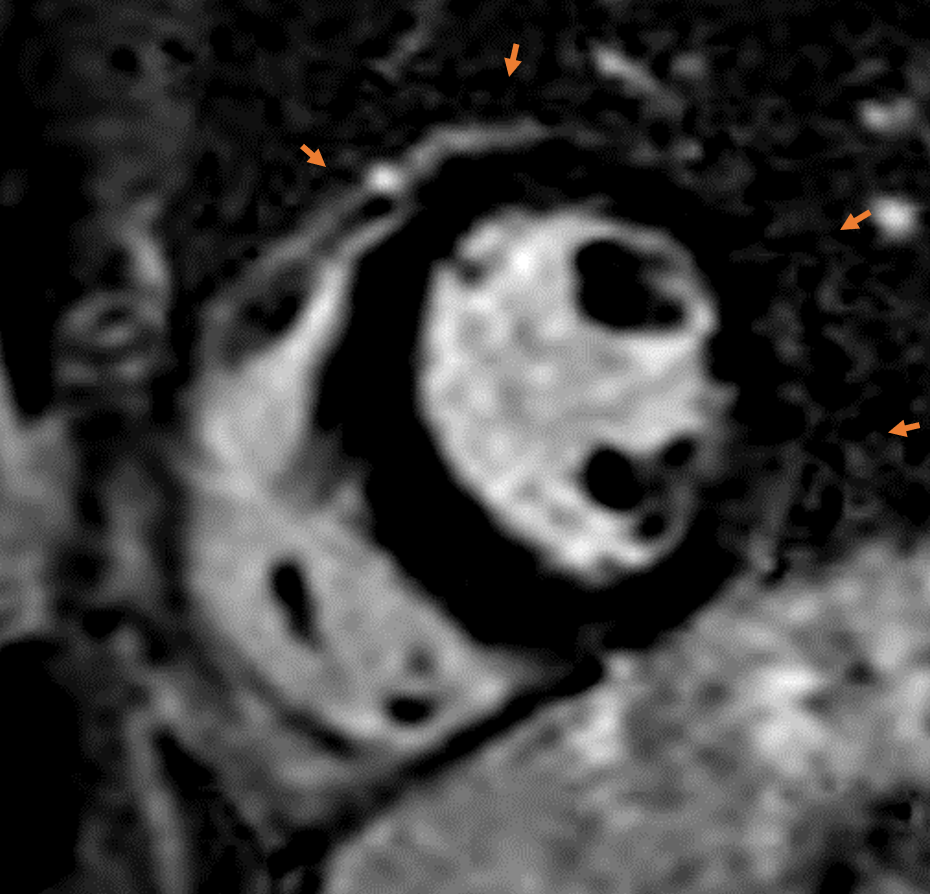
Figure 2D: Fat suppressed phase sensitive inversion recovery sequence short axis mid wall slice showing no myocardial or pericardial delayed gadolinium enhancement.
Figure 2D: Fat suppressed phase sensitive inversion recovery sequence short axis mid wall slice showing no myocardial or pericardial delayed gadolinium enhancement.
What is the most appropriate next step in management?
Show Answer
The correct answer is: B. Discontinue anti-inflammatory therapy.
The first case of COVID-19 was reported in Wuhan, China in December 2019 eventually leading to a global pandemic as declared by World Health Organization in March 2020.1 Clinical presentation varies from being asymptomatic to severe cases such as multi organ failure, acute respiratory distress syndrome (ARDS) and death. Cardiac involvement is a rare extra pulmonary manifestation of COVID-19 infection with adverse prognosis.
COVID-19 can cause myocardial injury, heart failure, arrhythmias, and pericardial inflammation.2 Specifically, acute pericarditis is an active inflammatory process involving pericardium which can be challenging to diagnose and treat. The pathophysiology of COVID-19 induced pericarditis is not well understood but it is hypothesized that it is a result of the exaggerated systemic inflammatory response, cytotoxic, and immune-mediated effects of the virus.3
The current European Society of Cardiology (2015) guidelines requires at least two of the following four criteria to diagnose acute pericarditis: a) pleuritic chest pain, improved by leaning forward or sitting up b) pericardial friction rub c) ST segment elevation and PR depression on ECG; d) new or worsening pericardial effusion.4 ECG changes are seen in 20% of pericarditis cases and can occur in four stages.5 Stage I depicts diffuse ST segment elevation and PR segment depression with reciprocal ST segment depression in leads aVR and V1 and PR segment elevation in aVR with normal looking T waves. Stage II is the normalization of PR and ST segments. T wave inversion is seen in stage III and normal ECG or persistence of T-wave inversion is witnessed in stage IV. Moreover, ECG in pericarditis lack Q waves. ST elevation in V6 and PR segment elevation especially in aVR is infrequent in pericarditis. The hallmark ECG sign of acute pericarditis involves diffuse ST segment elevation and PR segment depression, typically in inferior leads. However, the temporal evolution of the ECG changes varies from patient to patient.
ECG is a useful tool for evaluation of athletes with recent COVID-19 infection and seeking clearance to return to play. However, 70% of healthy athletes have repolarization abnormalities such as diffuse J-point elevation, tall T waves and ascending concave ST segments in inferior or lateral leads and as evidenced by American Heart Association and European Society of Cardiology6 and if performed, should be in the right clinical context. At present, ECG screening or other cardiovascular risk stratification is not recommended in athletes with prior COVID-19 infection in absence of systemic symptoms or had mild symptoms and remained asymptomatic after 10 days of self-isolation.7 Only athletes with development of new symptoms or moderate to severe symptoms are recommended to undergo cardiovascular risk stratification by further testing.
Additional supportive findings include: elevated levels of inflammatory markers (CRP or ESR); development of new or worsening pericardial effusion and in rare cases as tamponade on transthoracic echocardiogram; non-calcified pericardial thickening and enhancement on computed tomography; and enhancement or thickened pericardium on T1-weighted spin-echo images or late gadolinium enhancement (LGE) on cardiac magnetic resonance imaging.5 First line treatment includes high dose non-steroidal anti-inflammatory drugs (NSAIDs), and colchicine. Corticosteroids is the second line followed by biologics (as third line) and rarely pericardiectomy (fourth line).5
In a cross-sectional study of return to play cardiac testing conducted on 789 professional athletes who had COVID-19 infection, eventually, only five athletes had CMR imaging reflecting inflammatory heart disease (three with myocarditis and two with pericarditis) that demanded restriction from play.8 At present, there is insufficient data to support screening of athletes with CMR with suspected or prior confirmed COVID-19 infection.7 To identify the athlete population with true COVID-19 related CMR findings, it is necessary to have an athletic comparator group as LGE can also represent athletic remodeling. Infero-septal right ventricular LGE is a common finding in athletes which should not be confused with myocarditis.9
Current United States and European guidelines recommend restriction of physical activity until complete resolution of symptoms of pericarditis.10 Experience by Shah et al. showed that patients with pericarditis receiving medical management and who continue to exercise demonstrate worsening of LGE on CMR.11 Elevated inflammatory markers and LGE tend to improve with exercise restriction which hints towards the pro-inflammatory role of exercise in pericarditis, and keeping a goal heart rate of less than 100 beats per minute along with medical therapy for pericarditis helps in preventing relapse of pericarditis.11
In our patient, besides ECG findings suspicious of pericarditis, there was no evidence of ongoing pericardial disease. These ECG findings were physiological, related to his age and profession. Future studies are needed to identify the correlation between these ECG findings and underlying heart diseases, such as pericarditis or myocarditis, especially in this era of pandemic.
Adler Y, Charron P, Imazio M, et al. 2015 ESC Guidelines for the diagnosis and management of pericardial diseases. E Heart J 2015;36:2921–64.
Verma,BR, Montane B, Chetrit M, et al. Pericarditis and post-cardiac injury syndrome as a sequelae of acute myocardial infarction. Curr Cardiol Rep 2020;22:127.
Uberoi A, Stein R, Perez MV, et al. Interpretation of the electrocardiogram of young athletes. Circulation 2011;124:746–57.
Kim JH, Levine BD, Phelan D, et al. Coronavirus Disease 2019 and the athletic heart: emerging perspectives on pathology, risks, and return to play. JAMA Cardiol 2021;6:219–27.
Martinez MW, Tucker AM, Bloom OJ, et al. Prevalence of inflammatory heart disease among professional athletes with prior COVID-19 infection who received systematic return-to-play cardiac screening. JAMA Cardiol 2021;Mar 04:[Epub of print].
Clark DE, Parikh A, Dendy JM, et al. COVID-19 Myocardial Pathology Evaluation in AthleTEs with Cardiac Magnetic Resonance (COMPETE CMR). Circulation 2021;143:609.