A 57-year-old male patient presents to the outpatient clinic complaining of chest pain and shortness of breath after an atrial flutter ablation 10 days prior to his visit. His past medical history is significant for atrial flutter, non-ischemic cardiomyopathy (most recent left ventricular ejection fraction measured at 35%), hypertension, human immunodeficiency virus on highly active antiretroviral therapy (HAART), mild intermittent asthma and mild cognitive impairment. Medications include atorvastatin, aspirin, losartan, hydrochlorothiazide, metoprolol, dabigatran and HAART. Physical exam revealed jugular venous distension but was otherwise normal. Electrocardiogram showed normal sinus rhythm with occasional premature ventricular contractions (Figure 1). Chest X-ray performed in the office was significant for enlarged cardiac silhouette and loss of the normal cardiac contour (Figure 2). A transthoracic echocardiogram (TTE) was performed showing a large, circumferential pericardial effusion, an inferior vena cava (IVC) diameter of 3.4cm which collapsed <50% with inspiration, and significant variation of inflow velocities across the tricuspid and mitral valves during the respiratory cycle (Figure 3A-F). Given his symptoms and TTE findings, the patient was taken for pericardiocentesis where 500 mL of bloody pericardial fluid were removed. After the pericardiocentesis, the patient had only minimal improvement in his shortness of breath. A repeat TTE was performed (Figure 4A-F) showing significant septal bounce, continued inflow velocity variation across the tricuspid and mitral valve, and IVC plethora. Labs at the time of repeat TTE showed an elevated C-reactive protein.
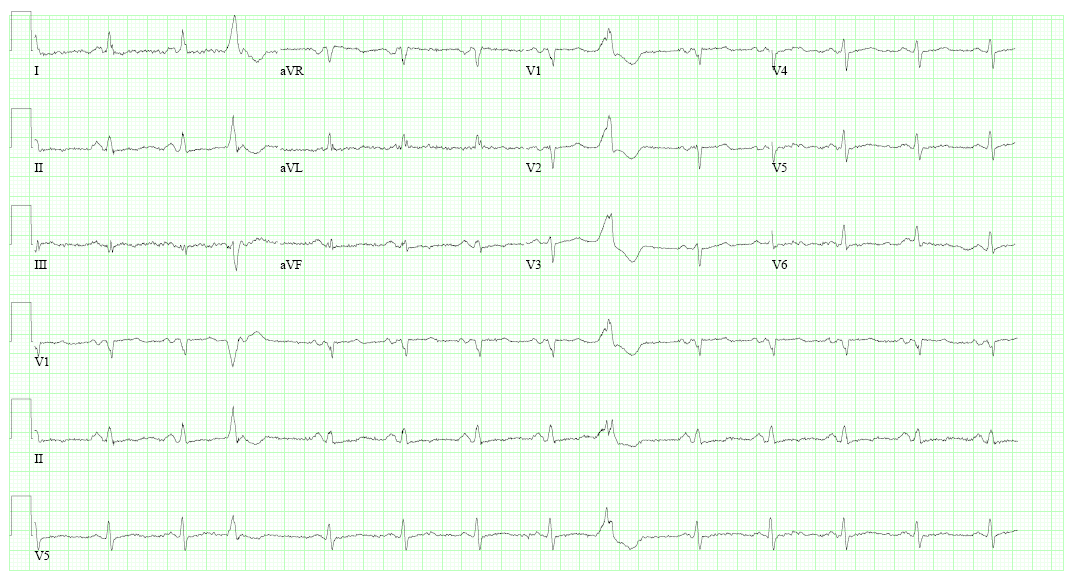
Figure 1: ECG at presentation in the outpatient clinic
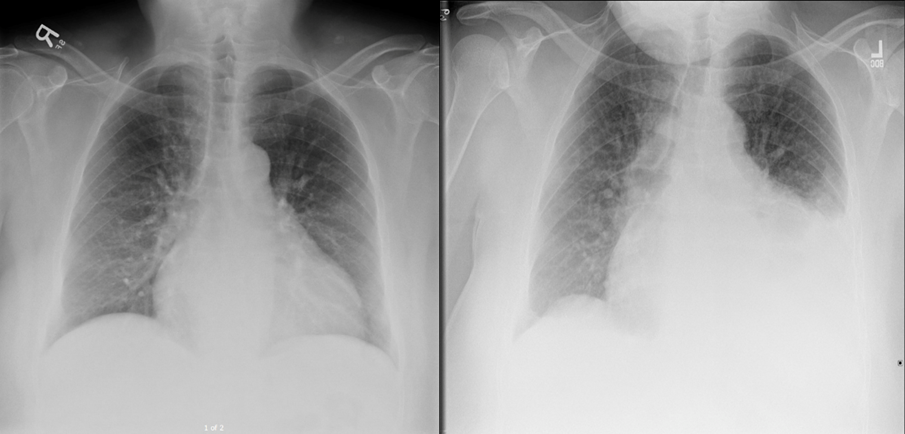
Figure 2: Chest X-ray 2 months prior to outpatient visit (left) and on the day of his clinic presentation (right)
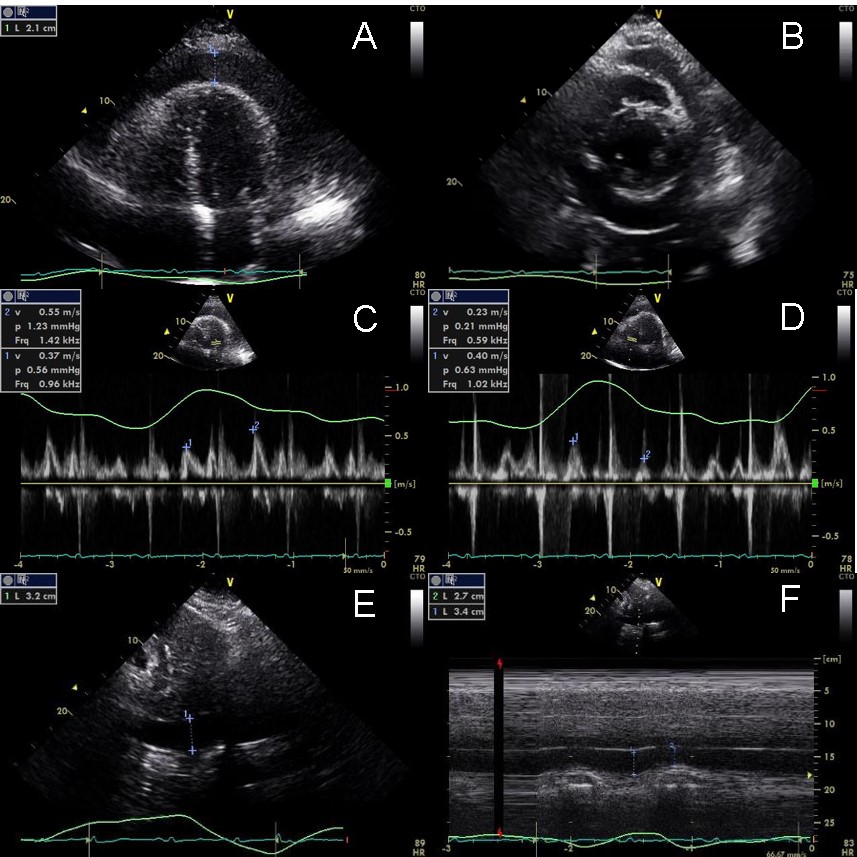
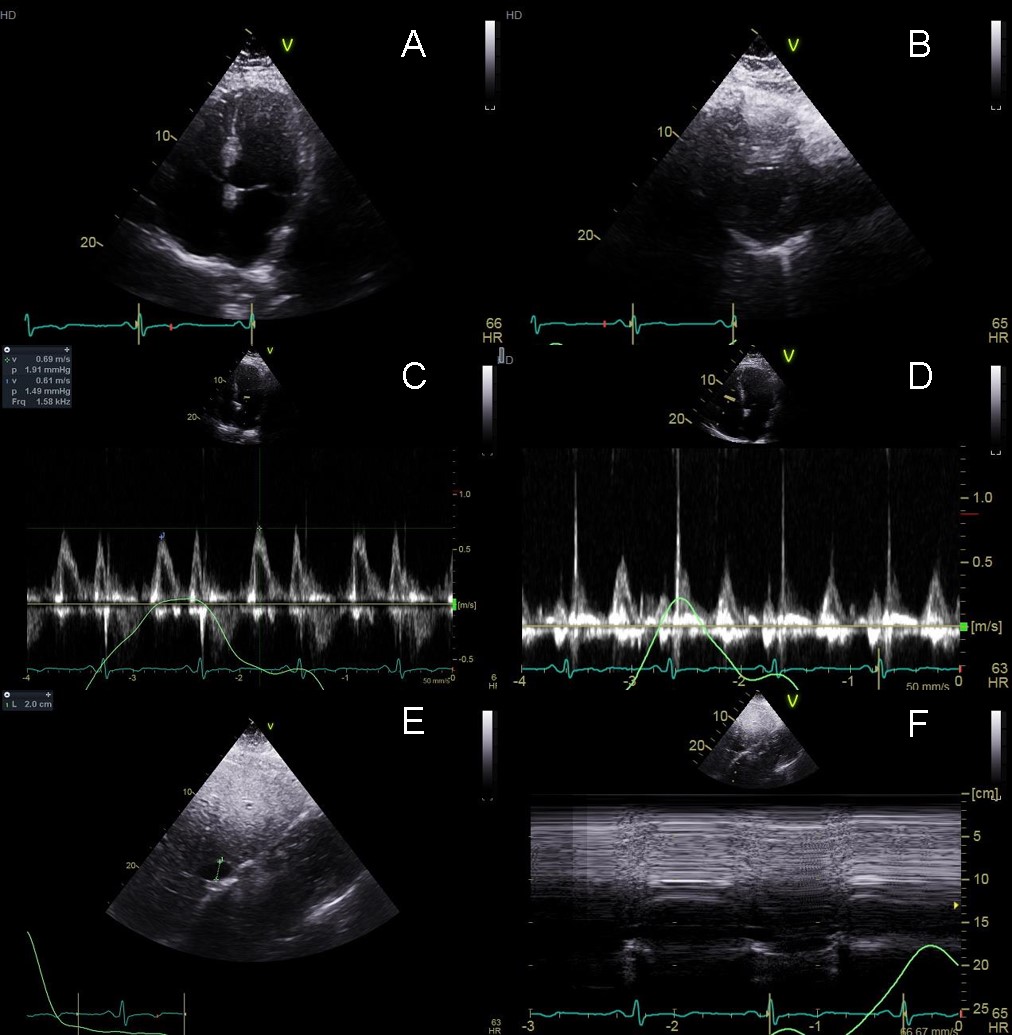
Figure 3: Transthoracic echocardiogram on the day of admission. Apical 4 chamber (Panel A) and parasternal short axis (Panel B) views help with sizing of the effusion. Inflow velocities across the mitral (Panel C) and tricuspid (Panel D) valves showed significant variation (33% and -74% respectively) throughout the respiratory cycle and the IVC was plethoric and non-collapsible (Panel E and F).
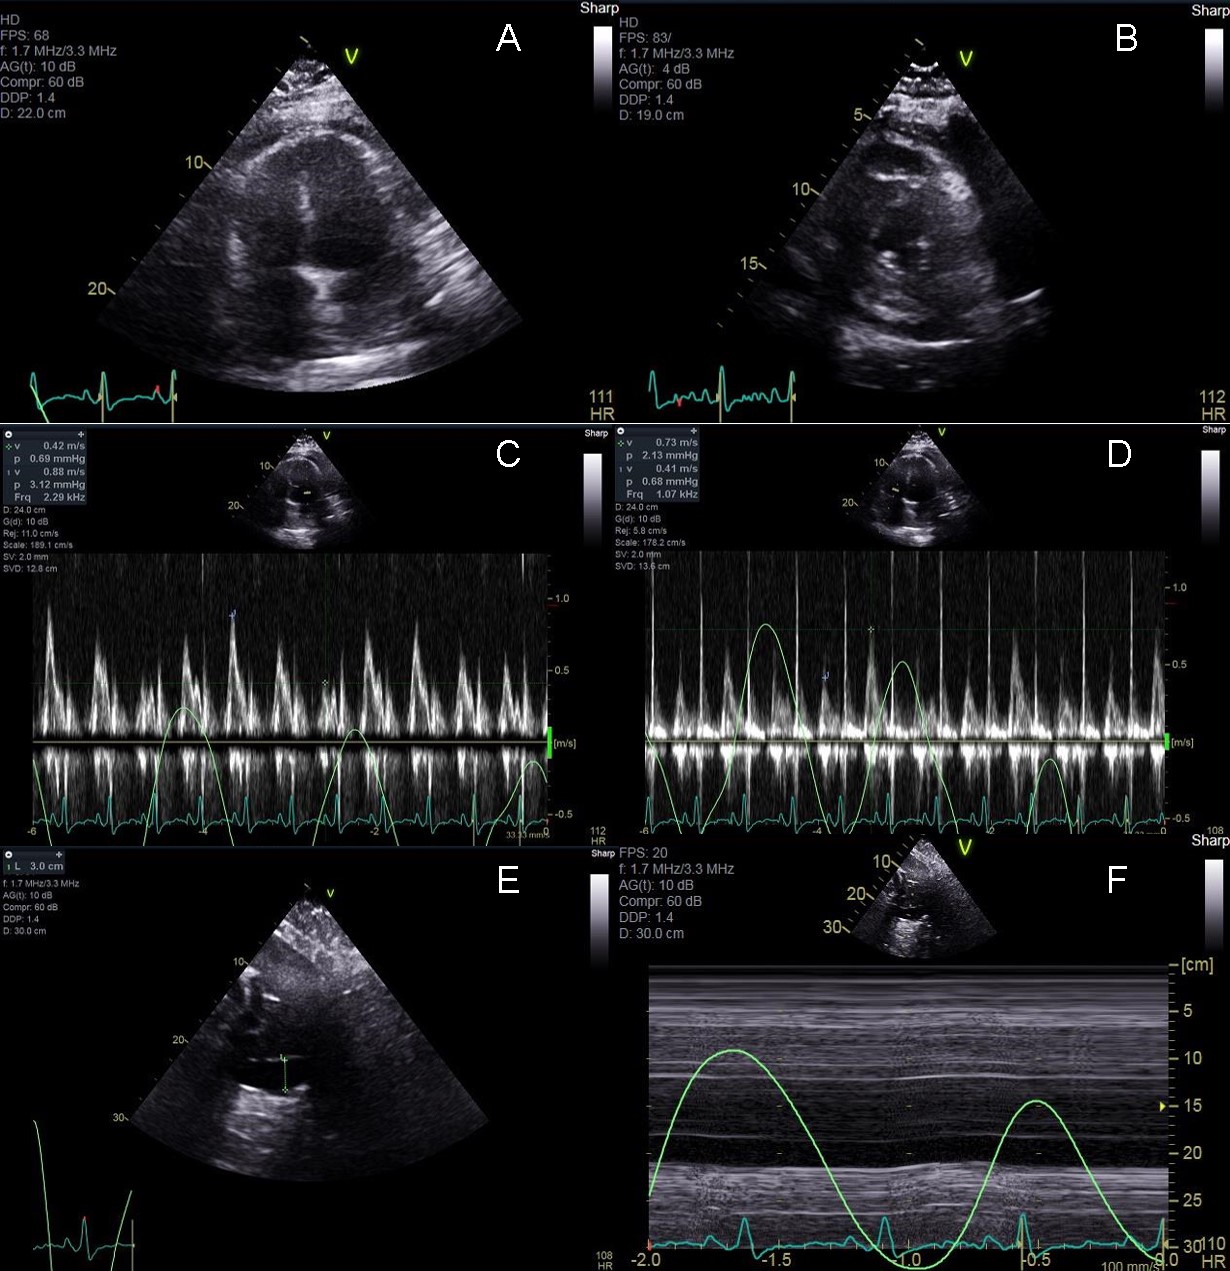
Figure 4: Transthoracic echocardiogram after pericardiocentesis. Apical 4 chamber (Panel A), and parasternal short axis (Panel B) show only a small residual effusion. Inflow velocities across the mitral (Panel C) and tricuspid (Panel D) valves still show significant variation (52% and -78% respectively) throughout the respiratory cycle and the IVC was plethoric and non-collapsible (Panel E and F).
The correct answer is: B. Trial of colchicine and nonsteroidal anti-inflammatory drugs for 3 months.
The patient is suffering from effusive constrictive pericarditis secondary to his post procedural pericardial effusion. The diagnosis of effusive constriction was made after this patient showed evidence of persistently elevated right atrial pressure after intrapericardial pressure was normalized using pericardiocentesis. Effusive constrictive pericarditis is a relatively rare diagnosis with only case series available in the literature.1-3 The largest series published in JACC: Cardiovascular Imaging in 2017 detailed 33 patients with effusive constrictive pericarditis after 205 pericardiocentesis procedures were performed. In their series, treatment regimens included steroids in three patients, NSAIDS in 13 patients and colchicine in six patients. Six of the 33 patients were rehospitalized and four patients ultimately died during follow up. Symptoms persisted in two patients despite medical therapy and ultimately required pericardiectomy.3 Similar results were seen in a series of 15 patients published in the New England Journal of Medicine in 2004.2 In this series, eight of the original 15 patients improved with medical therapy alone. The other seven patients ultimately required pericardiectomy due to persistent right heart failure symptoms.
Our patient's effusion was related to his recent ablation and associated inflammation. Repeat pericardiocentesis is not indicated given the complete resolution of his pericardial effusion during the first procedure. While pericardiectomy may ultimately be required for this patient, management with medications alone is successful in nearly 50% of cases. Additionally, some cases of effusive constrictive pericarditis have been shown to resolve spontaneously.3,4 Medical therapy should be tailored to the underlying process which caused the effusion—post-procedural inflammation for our patient. Colchicine and non-steroidal anti-inflammatory medications receive a Class I recommendation (Level of evidence A) for this diagnosis.1-3,5-7 Phrenic nerve injury is uncommon post typical atrial flutter ablation and would not cause these echocardiographic findings. Follow up TTE of our patient 6 months after diagnosis and after 3 months of therapy with colchicine and NSAID revealed no pericardial effusion, normalized inflow velocities and no evidence of increased right atrial pressure (Figure 5).
Figure 5: TTE 6 months after initial presentation and 3 months of colchicine and NSAID therapy showing resolution of echocardiographic signs of effusive constrictive pericarditis. Patient is feeling well without any residual shortness of breath or atrial flutter.
References
- Maisch B, Seferovic PM, Ristic AD, et al. Guidelines on the diagnosis and management of pericardial diseases executive summary: the task force on the diagnosis and management of pericardial diseases of the European Society of Cardiology. Eur Heart J 2004;25:587-610.
- Sagrista-Sauleda J, Angel J, Sanchez A, Permanyer-Miralda G, Soler-Soler J. Effusive-constrictive pericarditis. N Engl J Med 2004;350:469-75.
- Kim KH, Miranda WR, Sinak LJ, et al. Effusive-constrictive pericarditis after pericardiocentesis: incidence, associated findings, and natural history. JACC Cardiovasc Imaging 2017. [Epub ahead of print]
- Sagrista-Sauleda J, Permanyer-Miralda G, Candell-Riera J, Angel J, Soler-Soler J. Transient cardiac constriction: an unrecognized pattern of evolution in effusive acute idiopathic pericarditis. Am J Cardiol 1987;59:961-6.
- Imazio M, Bobbio M, Cecchi E, et al. Colchicine in addition to conventional therapy for acute pericarditis: results of the COlchicine for acute PEricarditis (COPE) trial. Circulation 2005;112:2012-6.
- Imazio M, Brucato A, Adler Y. A randomized trial of colchicine for ac ute pericarditis. N Engl J Med 2014;370:781.
- Li YL, Qiao SB, Wang JY, Chen YM, Luo J, Zhang HF. Colchicine in addition to conventional therapy for pericarditis recurrence: an update meta-analysis. Herz 2016;41:630-638.