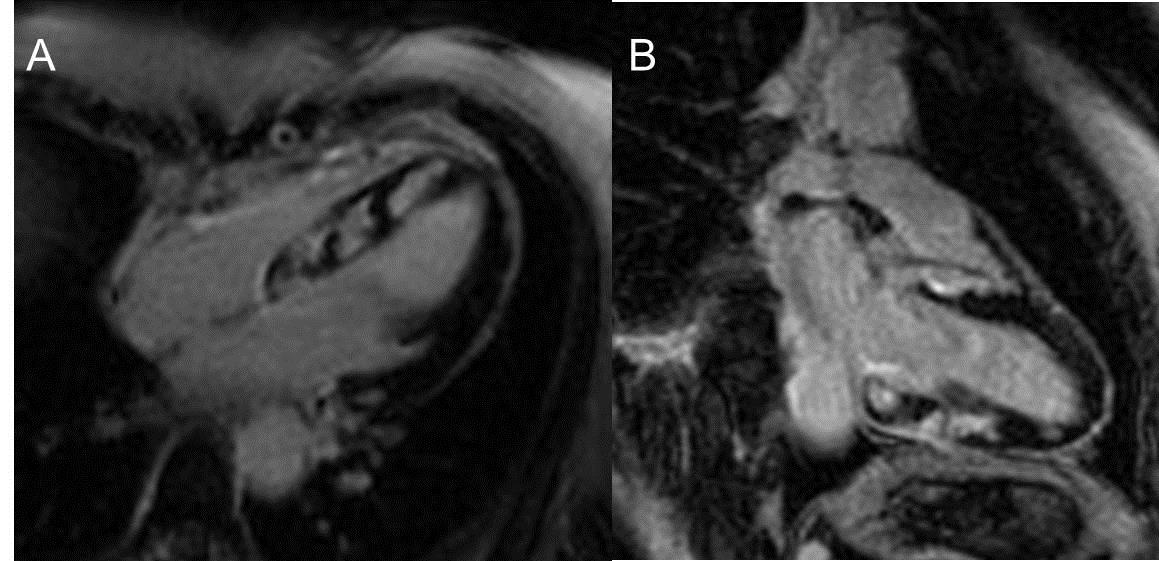
A 56-year-old female patient with no relevant prior medical history presented to the emergency department with sustained monomorphic ventricular tachycardia (VT). After cardioversion, she developed 3rd degree atrioventricular (AV) block requiring transvenous pacing. During admission, coronary angiography was performed and normal coronaries were found. A cardiac magnetic resonance imaging (MRI) was done and showed decreased left ventricular systolic function with hypokinesia of the anteroseptal, inferoseptal, and inferior walls and subepicardial and mid left ventricle (LV) wall areas of late gadolinium enhancement (LGE) in the anteroseptal, inferoseptal, inferior, and anterolateral walls, consistent with nonischemic regions of fibrosis (Figure 1).
Figure 1
Cardiac MRI delayed enhancement sequences in (A) 4-chamber and (B) 2-chamber showed patches of scar in the inferoseptal, anteroseptal, inferior, and basal anteroseptal walls.
Video 1
Video 2
Video 3
Cardiac MRI cine movies (Video 1: 2-chamber, Video 2: 4-chamber; Video 3: Short axis right ventricle (RV)/LV) show hypokinesia of the inferoseptal, anteroseptal, and inferior walls.
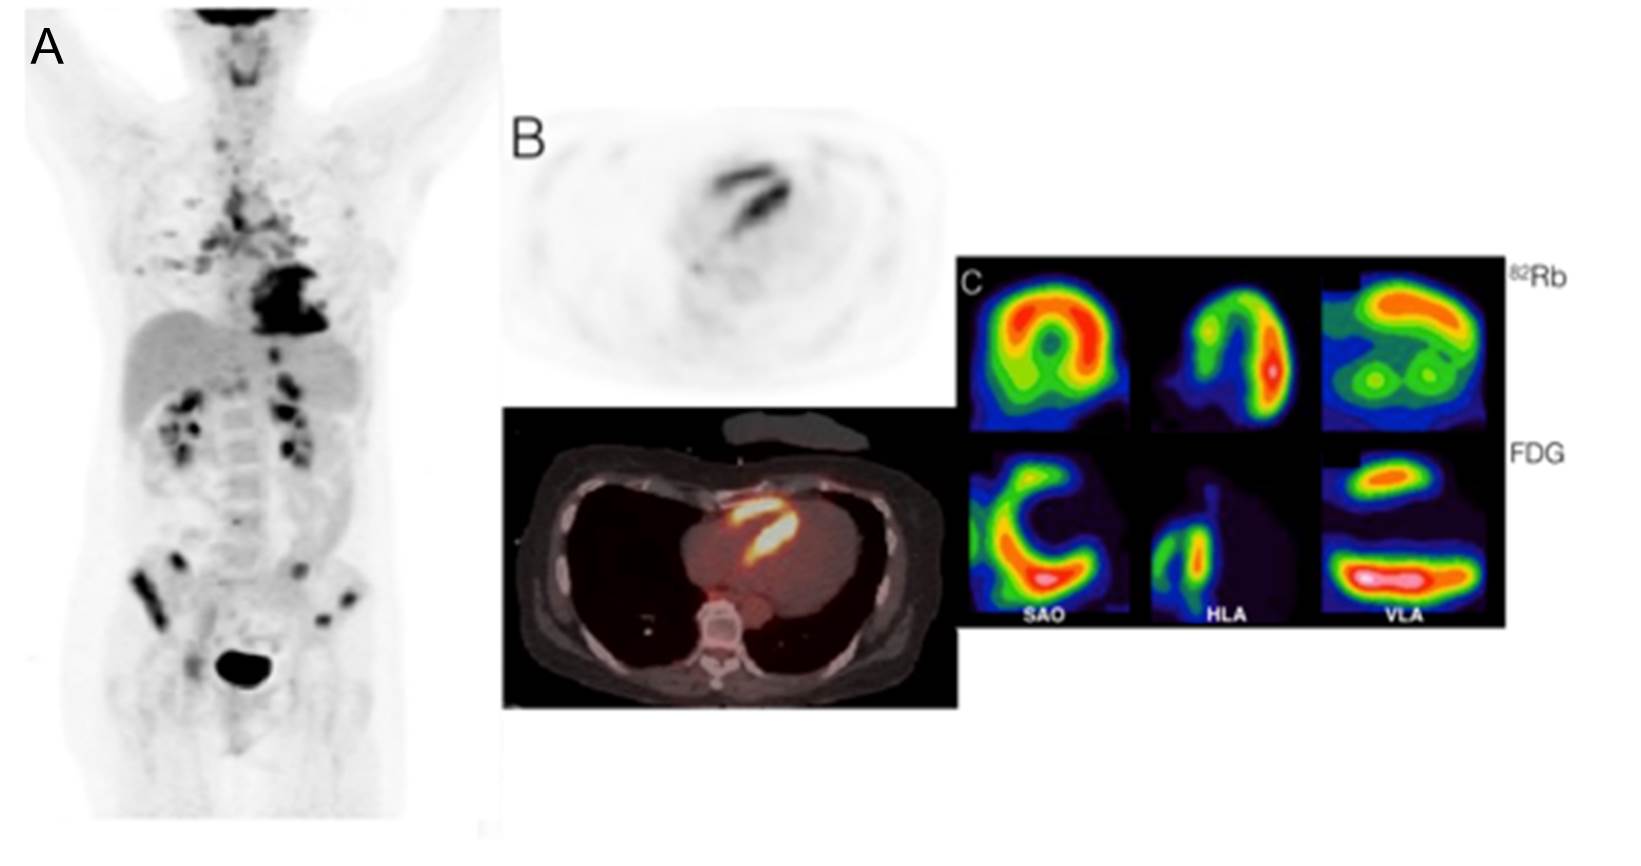
Given the MRI results as well as the history of VT followed by 3rd degree AV block, a fluorodeoxyglucose (FDG) positron emission tomography (PET) (cardiac and whole body) scan was subsequently performed and showed a mismatch between perfusion and metabolic imaging to further confirm the diagnosis and provide an imaging reference for future follow-up. FDG images demonstrate intense focal uptake in the basal and mid segments of the inferior, inferoseptal, and anteroseptal walls and also moderate uptake in the RV free wall. Rest images with Rubidium-82 showed perfusion defects in the same segments, suggesting areas of scar (or impaired perfusion caused by microvascular compression, likely due active inflammation). The gated images showed a moderate to severe reduction (32%) of the LV ejection fraction (LVEF) (Figure 2). The whole body FDG PET scan showed multiple FDG-avid lesions in the lungs, mediastinal and hilar lymph nodes, as well as in the lumbar spine, iliac wings, and ribs that were compatible with active systemic inflammatory disease.
Figure 2
Baseline Rubidium-82/FDG PET scan showed focal intense uptake in the basal and mid segments of the inferior, inferoseptal, and anteroseptal walls and also moderate uptake in the RV free wall. Rest images with Rubidium-82 showed perfusion defects in the same segments, suggesting areas of scar. (A) FDG whole body scout coronal view. (B) Transaxial views of FDG PET (upper) and fused FDG PET/ computed tomography (CT) (lower) showing intense septal and RV uptake. (C) Rubidium-82/FDG short axis, horizontal long axis, and vertical long axis.
An endomyocardial biopsy (EMB) was performed and revealed non-caseating granuloma. The diagnosis of cardiac and extra-cardiac sarcoidosis (CS) was made. A pacemaker/implantable cardiac defibrillator (ICD) was implanted, and immunosuppressive therapy was initiated with prednisone 50 mg daily. The patient was discharged and followed as an outpatient in a CS clinic.
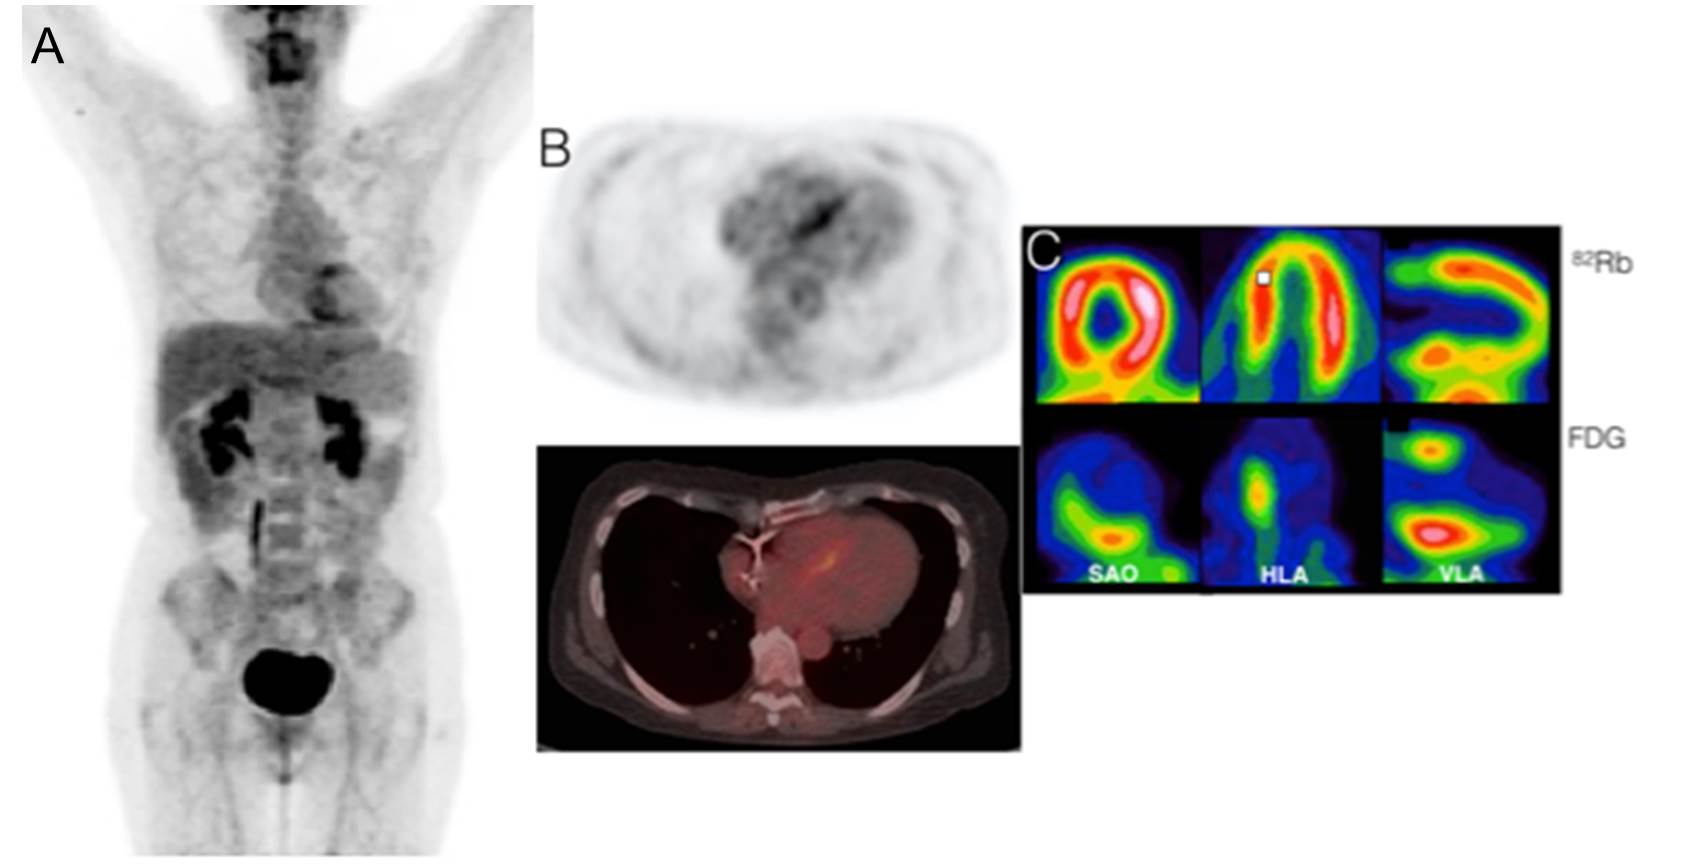
Six months later, follow-up FDG PET imaging was performed and showed improvement in the LVEF (32-42%) and in the perfusion images (inferior and septal segments) as well as significant decrease in myocardial FDG uptake. The whole body scan showed interval resolution of FDG-avid mediastinal and hilar lymphadenopathy and no evidence of extra-CS. At that time, the patient had no cardiac complaints, and the steroid dose was tapered (Figure 3).
Figure 3
Rubidium-82/FDG PET scan 6 months after diagnosis of CS showed improvement on rest perfusion images in the septal and inferior walls. Also, decreased LV and RV FDG uptake was noted, matching with the clinical response to corticoid therapy. (A) FDG whole body scout coronal view. (B) Transaxial views of FDG PET (upper) and fused FDG PET/CT (lower) showing reduced septal uptake and resolution of RV uptake. (C) Rubidium-82/FDG short axis, horizontal long axis, and vertical long axis.
On follow-up at 21 months, device interrogation showed runs of nonsustained VT and paroxysmal atrial fibrillation. LVEF had improved to 51%. At 26 months, the patient had an appropriate ICD shock for polymorphic VT. One month later, another appropriate shock occurred. Medical therapy was adjusted. Subsequently, the patient has had no cardiac symptoms for 1 year and no VT on interrogation of her ICD (Figure 4).
Figure 4
Image shows an FDG PET scan. (A) Whole body at baseline (heart maximum standardized uptake value = 13.8). (B) Whole body at 6 months (heart maximum standardized uptake value = 4.05). (C) Whole body at 21 months (heart maximum standardized uptake value = 4.1). (D) Whole body at 26 months (heart maximum standardized uptake value = 3.35 [less than liver maximum standardized uptake value = 3.52]).
Which of the following statements is MOST correct?
Show Answer
The correct answer is: C. In this case, ICD implantation is a Class I indication.
Answer A is incorrect for the following reasons. EMB is highly specific, but it has low sensitivity (20-30%)1 due to the focal nature of the CS, and typically extra-cardiac tissue is the first target due to the higher diagnostic yield and lower procedural risk. The procedure sensitivity can be increased when guided by electro-anatomic mapping or imaging (PET or cardiac magnetic resonance [CMR]). According to the Heart Rhythm Society (HRS) Expert Consensus,2 the diagnosis of CS is definitive when the presence of non-caseating granuloma on histological examination of the myocardial tissue is identified and no alternative cause is present. Table 1 summarizes the criteria for CS diagnosis.
Table 1: Diagnosis Criteria for CS
HRS Expert Consensus (2014)2
Revised Japanese Guidelines (2007)24
Histological diagnosis (definitive)
EMB showing presence of non-caseating granuloma with no alternative cause identified (including negative organismal stains)
EMB demonstrates non-caseating epithelioid cell granuloma with histological or clinical diagnosis of extra-CS
Clinical diagnosis (probable)
Histological diagnosis of extra-CS and one or more of
steroid +/- immunosuppressant responsive cardiomyopathy or heart block;
unexplained reduced LVEF (<40%);
unexplained sustained VT (spontaneous or induced);
Mobitz type II 2nd or 3rd degree heart block;
patchy uptake on dedicated cardiac PET (in a pattern consistent with CS);
LGE on CMR (in a pattern consistent with CS);
positive gallium uptake (in a pattern consistent with CS);
and other causes for the cardiac manifestation have been excluded.
Clinical or histological diagnosis of extra-CS and more than two major criteria or one major and more than two minor criteria.
Major criteria:
Advanced AV block
Positive cardiac gallium uptake
Depressed LVEF (<50%)
Minor criteria:
Abnormal electrocardiogram findings: Ventricular arrhythmias (VT, multifocal or frequent premature ventricular contractions), right bundle branch block, axis deviation, or abnormal Q-wave
Abnormal echocardiogram (regional abnormal wall motion or morphological abnormality [ventricular aneurysm or wall thickening])
Nuclear medicine: Perfusion defect by Thallium-201 or Technetium-99 myocardial scintigraphy
LGE on CMR
EMB: Interstitial or monocyte infiltration over moderate grade
The prevalence of isolated CS is not known, and its diagnosis can be challenging. The definition is also not clear. Kandolin et al. described 33 out of 55 patients (60%) who had what they termed "isolated CS," and their definition considered mediastinal lymph nodes as cardiac disease. In unpublished data from the University of Ottawa Heart Institute, the rate of isolated CS (which did not include mediastinal lymph nodes uptake) was about 5%. Up to 66% of the patients with isolated CS can remain undiagnosed after one EMB, and one third can remain without the diagnosis after the second biopsy.3 FDG PET guided-biopsy may increase its sensitivity.3,4
Answer B is incorrect for the following reasons. Heart block is a common presentation of clinically manifested CS because of the involvement of the basal septum by scar tissue or granulomas or involvement of the nodal artery.5 Nery et al. prospectively evaluated 32 patients aged 18-60 years presenting with unexplained 2nd or 3rd degree AV block and no previous history of CS in any organ. CS was diagnosed in 11 out of 32 (34%) subjects. Major adverse events occurred in 3 patients with CS, and none occurred in subjects with idiopathic AV block.6 In a retrospective registry analysis, Kandolin et al. reported that in 72 patients aged 18-55 years old with unexplained AV block, 25% of patients had CS (19%) or giant cell myocarditis (6%).7 The HRS Expert Consensus suggests that initial investigation of patients under 60 years old with unexplained Mobitz type II 2nd or 3rd degree AV block should include advanced cardiac imaging (CMR or FDG PET) to assess for CS and a computed tomographic (CT) scan of the chest to rule out pulmonary sarcoid. If one or more tests are positive, then biopsy confirmation should be the next step.2
VT has been reported as a first presentation of CS.8,9 A recent study screened patients with VT of unknown etiology for CS.10 After excluding classic outflow tract VT, fascicular VT, VT secondary to coronary artery disease and prior diagnosis of sarcoidosis, the included patients underwent FDG PET scans and EMB or extra-cardiac biopsy. Out of those 14 patients, 4 (28%) were subsequently diagnosed with CS.
The HRS recommends screening for CS in patients with unexplained advanced AV block.2 At this time, there is no formal recommendation for screening patients with unexplained VT for CS. However, VT is a recognized initial presentation of sarcoidosis. Therefore, CS should be included in the differential diagnosis for such patients.
In summary, FDG PET should be considered for detection of CS in the following situations:11
In patients with biopsy proven or clinical diagnosis of pulmonary/systemic sarcoidosis and one or more abnormal initial screening tests to screen for cardiac involvement (abnormal electrocardiogram defined as complete left or right bundle branch block and/or presence of unexplained pathological Q waves in two or more leads, abnormal echocardiogram defined as regional wall motion abnormalities, and/or wall aneurysm, and/or basal septum thinning, and/or LVEF < 50%, abnormal Holter defined as sustained or non-sustained VT, cardiac MRI suggestive of CS)
In young patients (<60 years) with new onset of unexplained, significant conduction system disease (sustained 2nd or 3rd degree AV block)
In patients with idiopathic sustained VT
In patients with proven CS to follow response to treatment with steroids and/or immunosuppressants
Answer C is correct for the following reasons. ICD implantation for CS is a Class I recommendation in patients with spontaneous sustained ventricular arrhythmias, including prior cardiac arrest and/or if LVEF ≤ 35%, despite optimal medical therapy and a period of immunosuppression (if there is active inflammation). ICD implantation is a Class IIa recommendation, independent of ventricular function, when CS is diagnosed and there is 1) already an indication for permanent pacemaker implantation; 2) unexplained syncope or near-syncope that is felt to be arrhythmic in etiology; 3) inducible sustained ventricular arrhythmias (>30 sec of monomorphic VT or polymorphic VT); or 4) clinically relevant VF on electrophysiologic study.2
Answer D is incorrect for the following reasons. Blankstein et al. studied 118 consecutive patients who underwent cardiac FDG and Rubidium-82 PET for inflammation assessment. The presence of both perfusion defect and FDG uptake was associated with death or sustained VT, even after adjusting for LVEF.14 Patients with RV uptake were also at greater risk.14 Mc Ardle et al. compared patients with CS who had VT with 1) patients with CS who had AV block and 2) control patients with asymptomatic CS. Patients with VT had significantly higher FDG uptake.15 Although there is currently no specific guideline recommendation regarding sudden-cardiac-death risk stratification in patients with CS, recent studies suggest higher risk in patients with CS with positive PET imaging and greater FDG uptake in patients with CS with VT.
MRI findings in patients with CS can vary according to disease progression stage and include regional wall motion abnormality, wall thickness, edema visualized T2 weighted sequences or fibrosis.5,14-16 Its accuracy is reported as 83%, and its negative predictive value can be up to 100%.14,17 MRI may also give prognostic information because the amount of scar is related to a worse prognosis.18,19 It is described as a predictor of death, aborted sudden cardiac death, and sustained or nonsustained VT19 and also has inverse correlation with LVEF.20 MRI cannot be done in patients with non-MRI compatible ICD and pacemaker leads, so it often cannot be used for follow-up. MRI and PET appear to provide complementary data with PET defining active inflammation and LGE MRI providing information about scar tissue formation and, to some extent, inflammation with T2 weighted images. Limited data suggest that FDG PET may be positive earlier.21 PET/MRI may enable the value of each modality to be realized in the same patient at the same time.22 Updated recommendations and standards for the role of imaging in defining CS and directing management23 are needed. Such guidelines are currently under development by the Society of Nuclear Medicine and Molecular Imaging Cardiovascular Council and the American Society of Nuclear Cardiology.
Answer E is incorrect for the following reasons. There is no guideline regarding the use of imaging methods to assess therapy response. However, individualized assessment with FDG PET appears promising. Osborne et al. analyzed 23 patients with CS who were treated with immunosuppressive therapies and were followed with serial FDG PET imaging. The authors found that a reduction in the volume or intensity of myocardial inflammation was associated with an increase in ejection fraction.24 Further studies are needed to better understand the role of serial FDG PET imaging in directing therapy.
References
Cooper LT, Baughman KL, Feldman AM, et al. The role of endomyocardial biopsy in the management of cardiovascular disease: a scientific statement from the American Heart Association, the American College of Cardiology, and the European Society of Cardiology Endorsed by the Heart Failure Society of America and the Heart Failure Association of the European Society of Cardiology. Eur Heart J 2007;28:3076-93.
Birnie DH, Sauer WH, Bogun F, et al. HRS expert consensus statement on the diagnosis and management of arrhythmias associated with cardiac sarcoidosis. Heart Rhythm 2014;11:1305-23.
Kandolin R, Lehtonen J, Graner M, et al. Diagnosing isolated cardiac sarcoidosis. J Intern Med 2011;270:461-8.
Simonen P, Lehtonen J, Kandolin R, et al. F-18-fluorodeoxyglucose positron emission tomography-guided sampling of mediastinal lymph nodes in the diagnosis of cardiac sarcoidosis. Am J Cardiol 2015;116:1581-5.
Roberts WC, McAllister HA Jr, Ferrans VJ. Sarcoidosis of the heart. A clinicopathologic study of 35 necropsy patients (group 1) and review of 78 previously described necropsy patients (group 11). Am J Med 1977;63:86-108.
Nery PB, Beanlands RS, Nair GM, et al. Atrioventricular block as the initial manifestation of cardiac sarcoidosis in middle-aged adults. J Cardiovasc Electrophysiol 2014;25:875-81.
Kandolin R, Lehtonen J, Kupari M. Cardiac sarcoidosis and giant cell myocarditis as causes of atrioventricular block in young and middle-aged adults. Circ Arrhythm Electrophysiol 2011;4:303-9.
Boglioli LR, Taff ML, Funke S, Mihalakis I. Sudden death due to sarcoid heart disease. J Forensic Sci 1998;43:1072-3.
Uusimaa P, Ylitalo K, Anttonen O, et al. Ventricular tachyarrhythmia as a primary presentation of sarcoidosis. Europace 2008;10:760-6.
Nery PB, Mc Ardle BA, Redpath CJ, et al. Prevalence of cardiac sarcoidosis in patients presenting with monomorphic ventricular tachycardia. Pacing Clin Electrophysiol 2014;37:364-74.
Blankstein R, Osborne M, Naya M, et al. Cardiac positron emission tomography enhances prognostic assessments of patients with suspected cardiac sarcoidosis. J Am Coll Cardiol 2014;63:329-36.
Mc Ardle BA, Birnie DH, Klein R, et al. Is there an association between clinical presentation and the location and extent of myocardial involvement of cardiac sarcoidosis as assessed by 18F- fluorodoexyglucose positron emission tomography? Circ Cardiovasc Imaging 2013;6:617-26.
Smedema JP, Snoep G, van Kroonenburgh MP, et al. Evaluation of the accuracy of gadolinium-enhanced cardiovascular magnetic resonance in the diagnosis of cardiac sarcoidosis. J Am Coll Cardiol 2005;45:1683-90.
Yang Y, Safka K, Graham JJ, et al. Correlation of late gadolinium enhancement MRI and quantitative T2 measurement in cardiac sarcoidosis. J Magn Reson Imaging 2014;39:609-16.
Vignaux O. Cardiac sarcoidosis: spectrum of MRI features. AJR Am J Roentgenol 2005;184:249-54.
Ohira H, Tsujino I, Ishimaru S, et al. Myocardial imaging with 18F-fluoro-2-deoxyglucose positron emission tomography and magnetic resonance imaging in sarcoidosis. Eur J Nucl Med Mol Imaging 2008;35:933-41.
Patel MR, Cawley PJ, Heitner JF, et al. Detection of myocardial damage in patients with sarcoidosis. Circulation 2009;120:1969-77.
Greulich S, Deluigi CC, Gloekler S, et al. CMR imaging predicts death and other adverse events in suspected cardiac sarcoidosis. JACC Cardiovasc Imaging 2013;6:501-11.
Ichinose A, Otani H, Oikawa M, et al. MRI of cardiac sarcoidosis: basal and subepicardial localization of myocardial lesions and their effect on left ventricular function. AJR Am J Roentgenol 2008;191:862-69.
Ohira H, Birnie DH, Pena E, et al. Comparison of (18)F-fluorodeoxyglucose positron emission tomography (FDG PET) and cardiac magnetic resonance (CMR) in corticosteroid-naive patients with conduction system disease due to cardiac sarcoidosis. Eur J Nucl Med Mol Imaging 2015;43:259-69.
White JA, Rajchl M, Butler J, Thompson RT, Prato FS, Wisenberg G. Active cardiac sarcoidosis: first clinical experience of simultaneous positron emission tomography--magnetic resonance imaging for the diagnosis of cardiac disease. Circulation 2013;127:e639-41.
Diagnostic standard and guidelines for sarcoidosis. Jpn J Sarcoidosis and Granulomatous Disord 2007;27:89-102.
Osborne MT, Hulten EA, Singh A, et al. Reduction in 18F-fluorodeoxyglucose uptake on serial cardiac positron emission tomography is associated with improved left ventricular ejection fraction in patients with cardiac sarcoidosis. J Nucl Cardiol 2014;21:166-74.