
Real-time Phase Contrast Imaging by Cardiac Magnetic Resonance for the Diagnosis of Constrictive Pericarditis
Introduction
Constrictive pericarditis (CP) is a potentially curable cause of heart failure that occurs from the restricted filling of the ventricles due to the loss of elasticity of the pericardium. Potential causes of CP include viral disease, radiation therapy, connective tissue disorders, and previous cardiac surgery. Patients with CP often present with right sided heart failure symptoms as well as symptoms related to reduced cardiac output with exertion. The diagnosis of CP is made with a combination of history, physical examination, non-invasive cardiac imaging, and cardiac catheterization. However, the diagnosis is challenging and is often delayed or missed. 1, 2
Non-invasive techniques for diagnosis of CP
Non-invasive cardiac imaging tests used to identify CP include echocardiography, cardiac computed tomography (CT), and cardiac magnetic resonance (cardiac MRI) imaging. Cardiac CT allows recognition of the morphological features of CP including increased pericardial thickness (>4mm) and pericardial calcification. Echocardiography provides assessment of ventricular function and the hemodynamic changes associated with constriction. Cardiac MRI uniquely combines the strengths of both cardiac CT and echocardiography for the diagnosis of CP 1-4. Morphological abnormalities helpful for the diagnosis CP by cardiac MRI include increased pericardial thickness (>4mm), myocardial and atrial tethering, conical ventricular deformity, and pericardial enhancement on post gadolinium enhancement imaging. Although pericardial thickening is a commonly used feature to diagnose CP, its absence does not categorically exclude CP as the pericardial thickness could be normal in 20% of patients with CP. Furthermore, the presence of pericardial thickening alone is not diagnostic for CP 5-7. Physiological features identified by CMR include early diastolic septal bounce on segmented steady state free precession (SSFP) images and respiro-phasic septal shift on real time cine imaging. The ratio of the IVC area to the aortic area > 1.8 at the level of the diaphragm can be used to identify increased right sided filling pressures associated with CP 8.
The hallmark hemodynamic feature of constrictive physiology is the dissociation between intrathoracic and intra-cardiac pressures and ventricular interdependence. Measurements of the velocities across both the mitral and tricuspid valves along with a respirometer by echocardiography can help identify ventricular interdependence by demonstrating the discordant respiro-phasic change in the inflow velocities between the two valves. Also the dissociation between the intra-cardiac and intrathoracic pressures is demonstrated by the magnitude of the respiro-phasic variation in velocities of the trans-valvular inflow. The values suggested as significant changes by the recent American Society of Echocardiography Guidelines is >25% fall across the mitral valve and >40% increase across the tricuspid valve after inspiration calculated based on peak velocities as: [(expiration-inspiration)/expiration]*100 9. Both the inspiratory and expiratory velocities should be measured at the first beat of the respiratory cycles. Although these features can be identified by echocardiography, simultaneous measurements of left and right ventricular velocities cannot be recorded over the respiratory cycles. Therefore, mitral and tricuspid flows are obtained at two separate time points as two different acquisitions. It is then the responsibility of the echocardiographer to relate the changes visually. Cardiac catheterization allows simultaneous measurement and recording of left and right ventricular pressures over the respiratory cycles making the recognition of ventricular interdependence easier. However, the procedure is invasive and requires a highly experienced catheterization laboratory to obtain diagnostic quality data.
Real time phase contrast imaging by cardiac MR
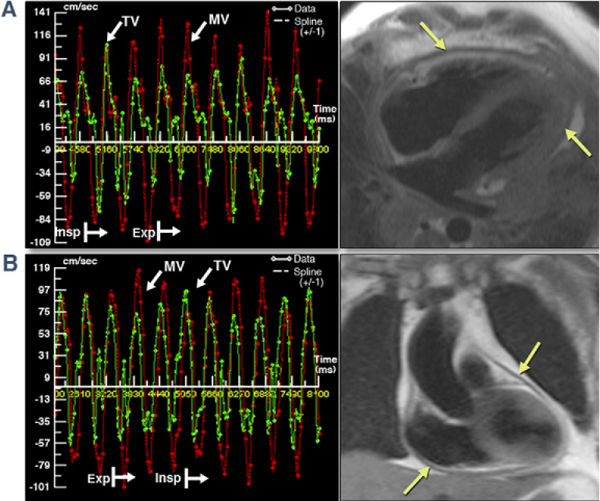
Phase-contrast MRI is a standard MRI tool used to quantify blood flow dynamics in CMR studies. In routine clinical practice, phase contrast imaging is either a breath held technique or a free breathing technique with images obtained through multiple averaging of data. Real-time Phase Contrast (RT-PC) imaging (available only as Work in Progress Packages) is a newer technique that is capable of providing real time display of flow velocities across any orifice 10. Real-time acquisition has the advantage of better patient compliance, shorter acquisition time and can be acquired even in patients with irregular heartbeats. Most uniquely, incorporation of RT-PC into imaging protocols for pericardial disease can help identify the vital hemodynamic signatures of CP - dissociation between intra-cardiac and intrathoracic pressures and ventricular interdependence 11. Most uniquely this sequence allows simultaneous measurement of flow velocities across the mitral and tricuspid valves (Figs 1 and 2). Similar to cardiac catheterization both the mitral and tricuspid velocities over the respiratory cycles are superimposed on each other making recognition of these discordant changes easier.
RT-PC MRI Acquisition and Analysis
Acquisition and analysis of RT-PC MRI data in patients with constriction is relatively straightforward. Using a 4 chamber cine image, a slice should be set up across both the mitral and tricuspid valves (Figure1) just on the ventricular side of the annulus. Trans-mitral and trans-tricuspid flow velocity data is then acquired simultaneously using a RT-PC sequence with through-plane velocity encoding. The patients are instructed to breathe freely during the acquisition. The typical respiro-ophasic hemodynamic changes of pericardial constriction can be reliably demonstrated by RT-PC technique acquired over 10-20s 11. Quantification of the phase contrast data is performed by drawing regions of interest encircling the central portion of the mitral valve and tricuspid valve inflow from the velocity-encoded images (Figs 1B and 1c) and propagated to all frames. Careful attention should be paid to avoiding the LVOT when the ROIs are propagated. The ROIs should be checked on each frame to ensure consistent placement. The early diastolic mitral inflow peak velocities (E) for mitral and tricuspid valves are measured from the first heartbeat of the respective inspiratory and expiratory phase. The phase of respiration is identified from the position of the diaphragm on the magnitude images. The percentage of maximal respiratory change in inflow E velocity for MV is calculated as (MV expiratory E- Inspiratory E)/(inspiratory E)12, 13 and for the tricuspid valve calculated as (TV inspiratory E – expiratory E)/(expiratory E) 13. This is different from that outlined in the current ASE recommendations as the only available published study using CMR based RT-PC imaging calculated the variabilities using these formulas.11
In the only published study, discordant trans MV and TV flows with respiration demonstrated by RT-PC had excellent sensitivity and specificity for the diagnosis of CP. The trans-MV inflow velocity variation of >25% and trans-TV velocity variation of >45% can be used to identify the hemodynamic changes of CP. 11 Trans MV flow variation, is a better marker of the constrictive physiology than the trans-tricuspid variability. 13
Conclusion
For the diagnosis of constrictive pericarditis it is imperative to demonstrate the hemodynamic changes of CP. Cardiac MR based RT-PC imaging provides a non-invasive, fast and reliable assessment of two important hemodynamic features of CP. The advantages of RT-PC imaging is the rapid acquisition time and non-breath held technique without significant compromise of temporal resolution. This technique may have a role differentiating the hemodynamic changes of constrictive and restrictive cardiomyopathy although this has not been formally studied. Although the RT-PC technique is unique and has great potential, the findings have to be first validated further in larger studies before routine clinical application.
Figure 1: RT-PC Acquired Across MV and TV
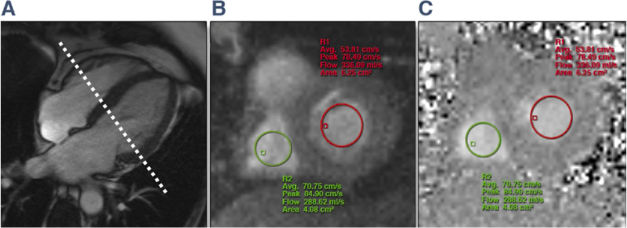
Figure 2: Respirophasic Variation in MV and TV Inflow Velocities by RT-PC CMR
References
- Verhaert, D., et al., The role of multimodality imaging in the management of pericardial disease. Circ Cardiovasc Imaging, 2010. 3(3): p. 333-43.
- Yared, K., et al., Multimodality imaging of pericardial diseases. JACC Cardiovasc Imaging, 2010. 3(6): p. 650-60.
- Francone, M., et al., Real-time cine MRI of ventricular septal motion: a novel approach to assess ventricular coupling. J Magn Reson Imaging, 2005. 21(3): p. 305-9.
- Francone, M., et al., Assessment of ventricular coupling with real-time cine MRI and its value to differentiate constrictive pericarditis from restrictive cardiomyopathy. Eur Radiol, 2006. 16(4): p. 944-51.
- Talreja, D.R., et al., Constrictive pericarditis in 26 patients with histologically normal pericardial thickness. Circulation, 2003. 108(15): p. 1852-7.
- Nishimura, R.A., Constrictive pericarditis in the modern era: a diagnostic dilemma. Heart, 2001. 86(6): p. 619-23.
- Talreja, D.R., et al., Constrictive pericarditis in the modern era: novel criteria for diagnosis in the cardiac catheterization laboratory. J Am Coll Cardiol, 2008. 51(3): p. 315-9.
- Hanneman, K., et al., Cardiovascular CT in the diagnosis of pericardial constriction: predictive value of inferior vena cava cross-sectional area. J Cardiovasc Comput Tomogr, 2014. 8(2): p. 149-57.
- Klein, A.L., et al., American Society of Echocardiography clinical recommendations for multimodality cardiovascular imaging of patients with pericardial disease: endorsed by the Society for Cardiovascular Magnetic Resonance and Society of Cardiovascular Computed Tomography. J Am Soc Echocardiogr, 2013. 26(9): p. 965-1012 e15.
- Joseph, A., et al., Real-time flow MRI of the aorta at a resolution of 40 msec. J Magn Reson Imaging, 2014. 40(1): p. 206-13.
- Thavendiranathan, P., et al., Simultaneous right and left heart real-time, free-breathing CMR flow quantification identifies constrictive physiology. JACC Cardiovasc Imaging, 2012. 5(1): p. 15-24.
- Oh, J.K., et al., Diagnostic role of Doppler echocardiography in constrictive pericarditis. J Am Coll Cardiol, 1994. 23(1): p. 154-62.
- Hatle, L.K., C.P. Appleton, and R.L. Popp, Differentiation of constrictive pericarditis and restrictive cardiomyopathy by Doppler echocardiography. Circulation, 1989. 79(2): p. 357-70.
Keywords: Cardiac Catheterization, Cardiac Imaging Techniques, Cardiac Output, Cardiomyopathy, Restrictive, Catheterization, Connective Tissue, Constriction, Diaphragm, Diastole, Echocardiography, Elasticity, Ficus, Gadolinium, Heart, Heart Failure, Magnetic Resonance Spectroscopy, Mitral Valve, Patient Compliance, Pericarditis, Constrictive, Pericardium, Physical Examination, Physical Exertion, Tomography, Tomography, X-Ray Computed, Tricuspid Valve, Ventricular Pressure
< Back to Listings