Business of Medicine | MedAxiom Report: 2021 CV Provider Compensation, Production Survey

MedAxiom's ninth annual Cardiovascular Provider Compensation and Production Survey Report – which unveils trends across cardiology, surgery, advanced practice providers (APPs) and nonclinical compensation – reveals the true impact of the coronavirus pandemic on cardiovascular programs from coast to coast.
"The COVID-19 pandemic has rocked the health care industry requiring cardiovascular (CV) programs to rapidly adapt to the everchanging environment. The 2020 data showcased in this report are particularly interesting, revealing how challenging the pandemic was for cardiovascular program volumes in 2020 and the significant impact of CARES Act monies and other federal support on provider compensation," notes Joel Sauer, MBA, report author and MedAxiom's executive vice president of consulting.
In addition to highlighting comparisons between private and integrated models, the 2021 report features new panel size metrics for workforce planning. Programs can use this comprehensive report to strategically plan for 2022 and beyond.
Report Highlights

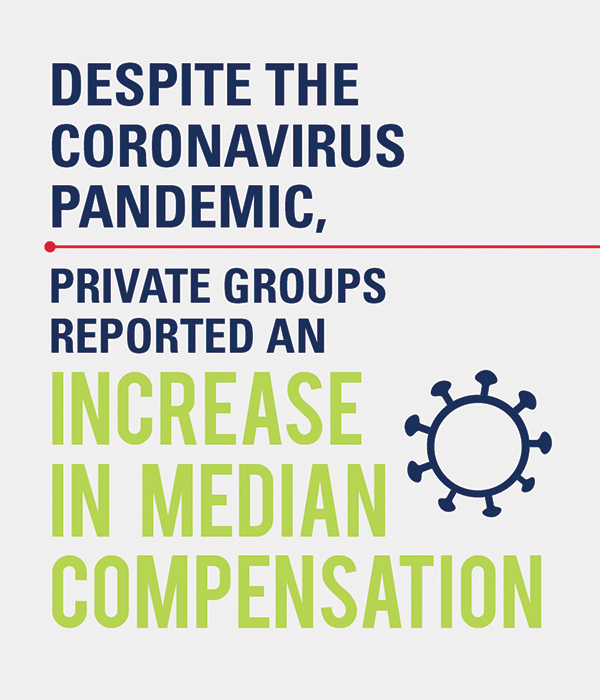
While cardiology production was significantly down, cardiology compensation fared well in 2020. In fact, private group cardiologist compensation rose.

New patient volumes were the lowest in the past five years due to the pandemic.

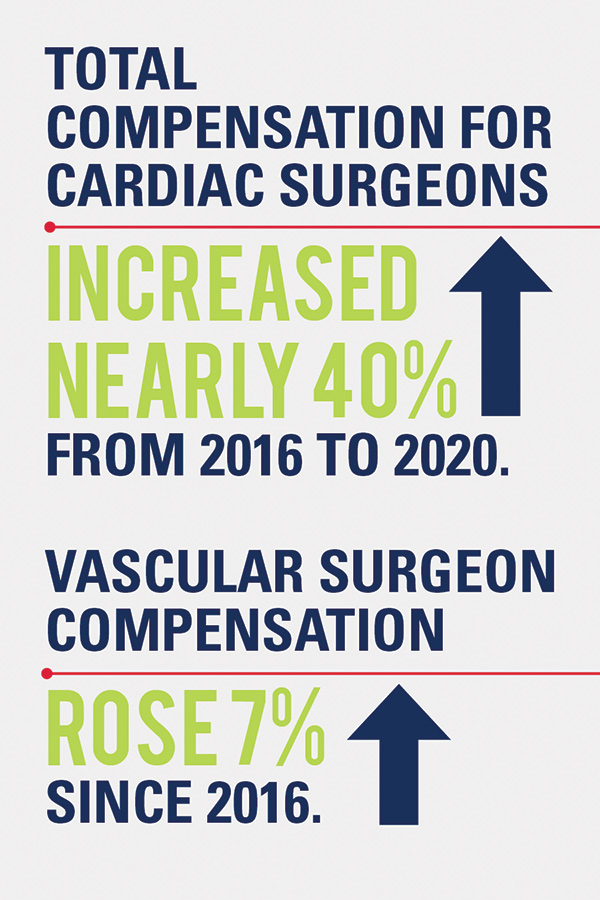
The market value of cardiac surgeons continues to rise; compensation has increased by 39% since 2016.

A new patient panel measure shows a downward trend for median physician FTE per 1,000 active patients suggesting the cardiology community is moving more care to APPs as part of its clinical strategy.
"Data are at the heart of MedAxiom. For 20 years, MedAxiom has been transforming cardiovascular care by driving the data revolution. 2020 was an unprecedented year resulting in a sea change that will impact the cardiovascular industry for years to come. MedAxiom's annual survey – designed for cardiology, by cardiology – arms programs with actionable data and unparalleled insights to thrive in the new normal and transform care," says Jerry Blackwell, MD, MBA, FACC, MedAxiom president and CEO.
Pandemic Impact
MedAxiom reported extensively on the impact of the pandemic on the cardiovascular community, with survey data collected in real-time showing volume declines of up to 50% in Spring 2020, then slowly but never fully recovering. Impacting the 2020 data were huge amounts of federal stimulus monies pumped into struggling American businesses, including cardiovascular groups. Further, there were significantly varied reactions by employers who impact more than 85% of cardiologists and cardiovascular physicians. These factors must be considered when reviewing these survey results and will certainly challenge valuation experts throughout the country.
Patient Panel
For nearly a decade, MedAxiom has collected the patient panel as part of the MedAxcess data submission process. MedAxcess, the cardiovascular industry's leading proprietary database and business intelligence application, includes between four and five million active cardiology patients being managed by thousands of cardiologists of various subspecialties from nearly 150 practices.
Since 2012, the median total provider FTE per 1,000 active patients has fluctuated for both integrated and private groups but in general shows a downward trend. This trend is greater when focusing only on the physicians and especially for physicians in integrated practices. The trend lines suggest that while the number of providers per 1,000 active patients might be declining, the delta – the APPs working with cardiologists to make up the total provider count – is increasing, even more so for integrated practices.
Cardiology Results
Continuing a longstanding trend in the data, the percentage of integrated (employed or professional services agreement) groups inched up again in 2020, now representing nearly 87% of the total. While there have been some high-profile, albeit isolated, divorces of cardiologists from a hospital employment model, the 2020 data show this is far from a trend.
Like in years past, electrophysiologists and interventionalists are the top earners amongst cardiologists, with median compensation per FTE reported at $678,495 and $674,910 respectively overall. Although the gap has narrowed over the years, cardiologists in integrated ownership models out-earn private physicians at every subspecialty level.
Also, as in years past, the South leads in terms of program participants with nearly 60% of the 2020 respondents from that region. In fact, over one-third of respondents come from just two Southern states: Florida and Texas. This region reports higher wRVUs and total compensation per cardiologist than the other regions.
Despite the coronavirus pandemic that disrupted the delivery of cardiovascular services for several months in 2020, cardiology compensation fared quite well. In fact, private groups reported an increase in median compensation in 2020. Integrated physicians fell back in 2020 but still reported the second highest median total in five years. These compensation data are even more surprising given that total production (as measured by wRVUs) actually fell for both private and integrated groups.
Surgery Results
All of 2020 survey respondents are integrated with a hospital or health system, a sign that private practice surgeons have become rare.
The market value of cardiac surgeons continues to rise as evidenced by the trend in median compensation over time. In 2020, cardiac surgeons reported their highest total compensation since MedAxiom began collecting data at a median of $901,142. This represents a 39% increase from 2016. Vascular surgery also reported its highest median compensation per FTE surgeon in 2020 at $602,649. This represents a more modest 7% increase since 2016.
Cardiac surgeon production, as measured by wRVUs, fell back slightly in 2020 to a median of 9,668 per FTE. This represents a roughly 8% decrease year-over-year but is still similar to median annual totals from previous years. Vascular surgery bucked that trend by reporting higher median wRVU production per FTE in 2020 as compared to 2019, with median production of 9,249 per FTE. Vascular surgery's 2020 median wRVU production was 96% that of cardiac surgery, the narrowest that gap has been in the past five years.
APP Results
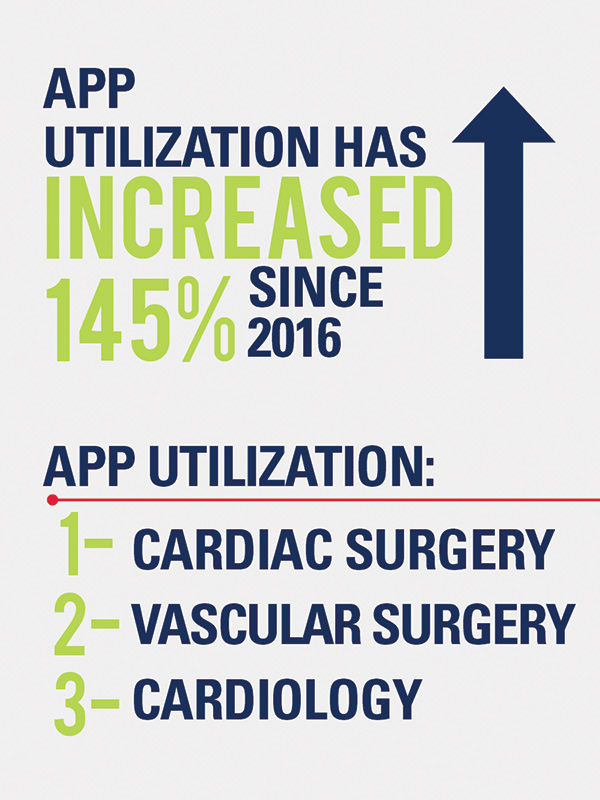
Cardiology's utilization of APPs has increased each year since 2016, with the median number of APPs per physician FTE now hitting 0.57 FTEs. This represents a 145% increase in that five-year timeline. These data demonstrate the growing importance of these professionals in the delivery of cardiology care.
Long a staple in the surgical practice, the 2021 survey finds that cardiac surgery continues to report higher utilization of APPs than cardiology. In fact, in cardiac surgery APPs outnumber surgeons with a median of 1.28 APP FTEs per physician. While not to the same extent as cardiac surgery, vascular surgery also relies heavily on APP resources, reporting a median 0.75 APP FTE per physician.
Nonclinical Compensation Results
Hospital incentives make up the largest portion of nonclinical compensation earned, with median compensation of $29,900 per FTE reported in 2020. This one source makes up nearly 82% of the total median nonclinical compensation earned of $36,492 per FTE. The top 10% of programs, the 90th percentile, have total nonclinical compensation in excess of $100,000 per cardiologist.
Download the full report at MedAxiom.com/CompSurvey.
Clinical Topics: Cardiac Surgery, Cardiovascular Care Team, COVID-19 Hub, Invasive Cardiovascular Angiography and Intervention
Keywords: ACC Publications, Cardiology Magazine, Cardiologists, Motivation, Coronavirus, Health Care Sector, Ownership, Benchmarking, Pandemics, Divorce, Florida, Texas, COVID-19, Data Management, Cardiology, Surgeons, Cardiac Surgical Procedures, Private Practice, Workforce, Surveys and Questionnaires, Hospitals, Employment
< Back to Listings