Feature | Ten Americas: Growing Disparities Creating Demographic Chasms

Disparities in life expectancy, driven by race, geography, socioeconomic status and systemic inequities, have widened alarmingly – from a 12.6-year gap in 2000 to a staggering 20.4 years by 2021 in the U.S.1 This finding and more come from a new analysis of data from the last two decades. The growing chasm in life expectancy across demographic groups in the country underscores an urgent, multifaceted health crisis that cannot be ignored.
These findings, exacerbated by the COVID-19 pandemic, point to an uneven playing field where communities burdened by poverty, segregation and limited health care access face markedly shorter lifespans. For cardiologists, this evidence reinforces the need to address the social determinants of health as a clinical priority, reshaping care strategies to bridge these deadly divides.
"The extent and magnitude of health disparities in American society are truly alarming in a country with the wealth and resources of the USA," said senior author Christopher JL Murray, MD, DPhil, director of the Institute for Health Metrics and Evaluation (IHME; University of Washington, Seattle), in a press release.
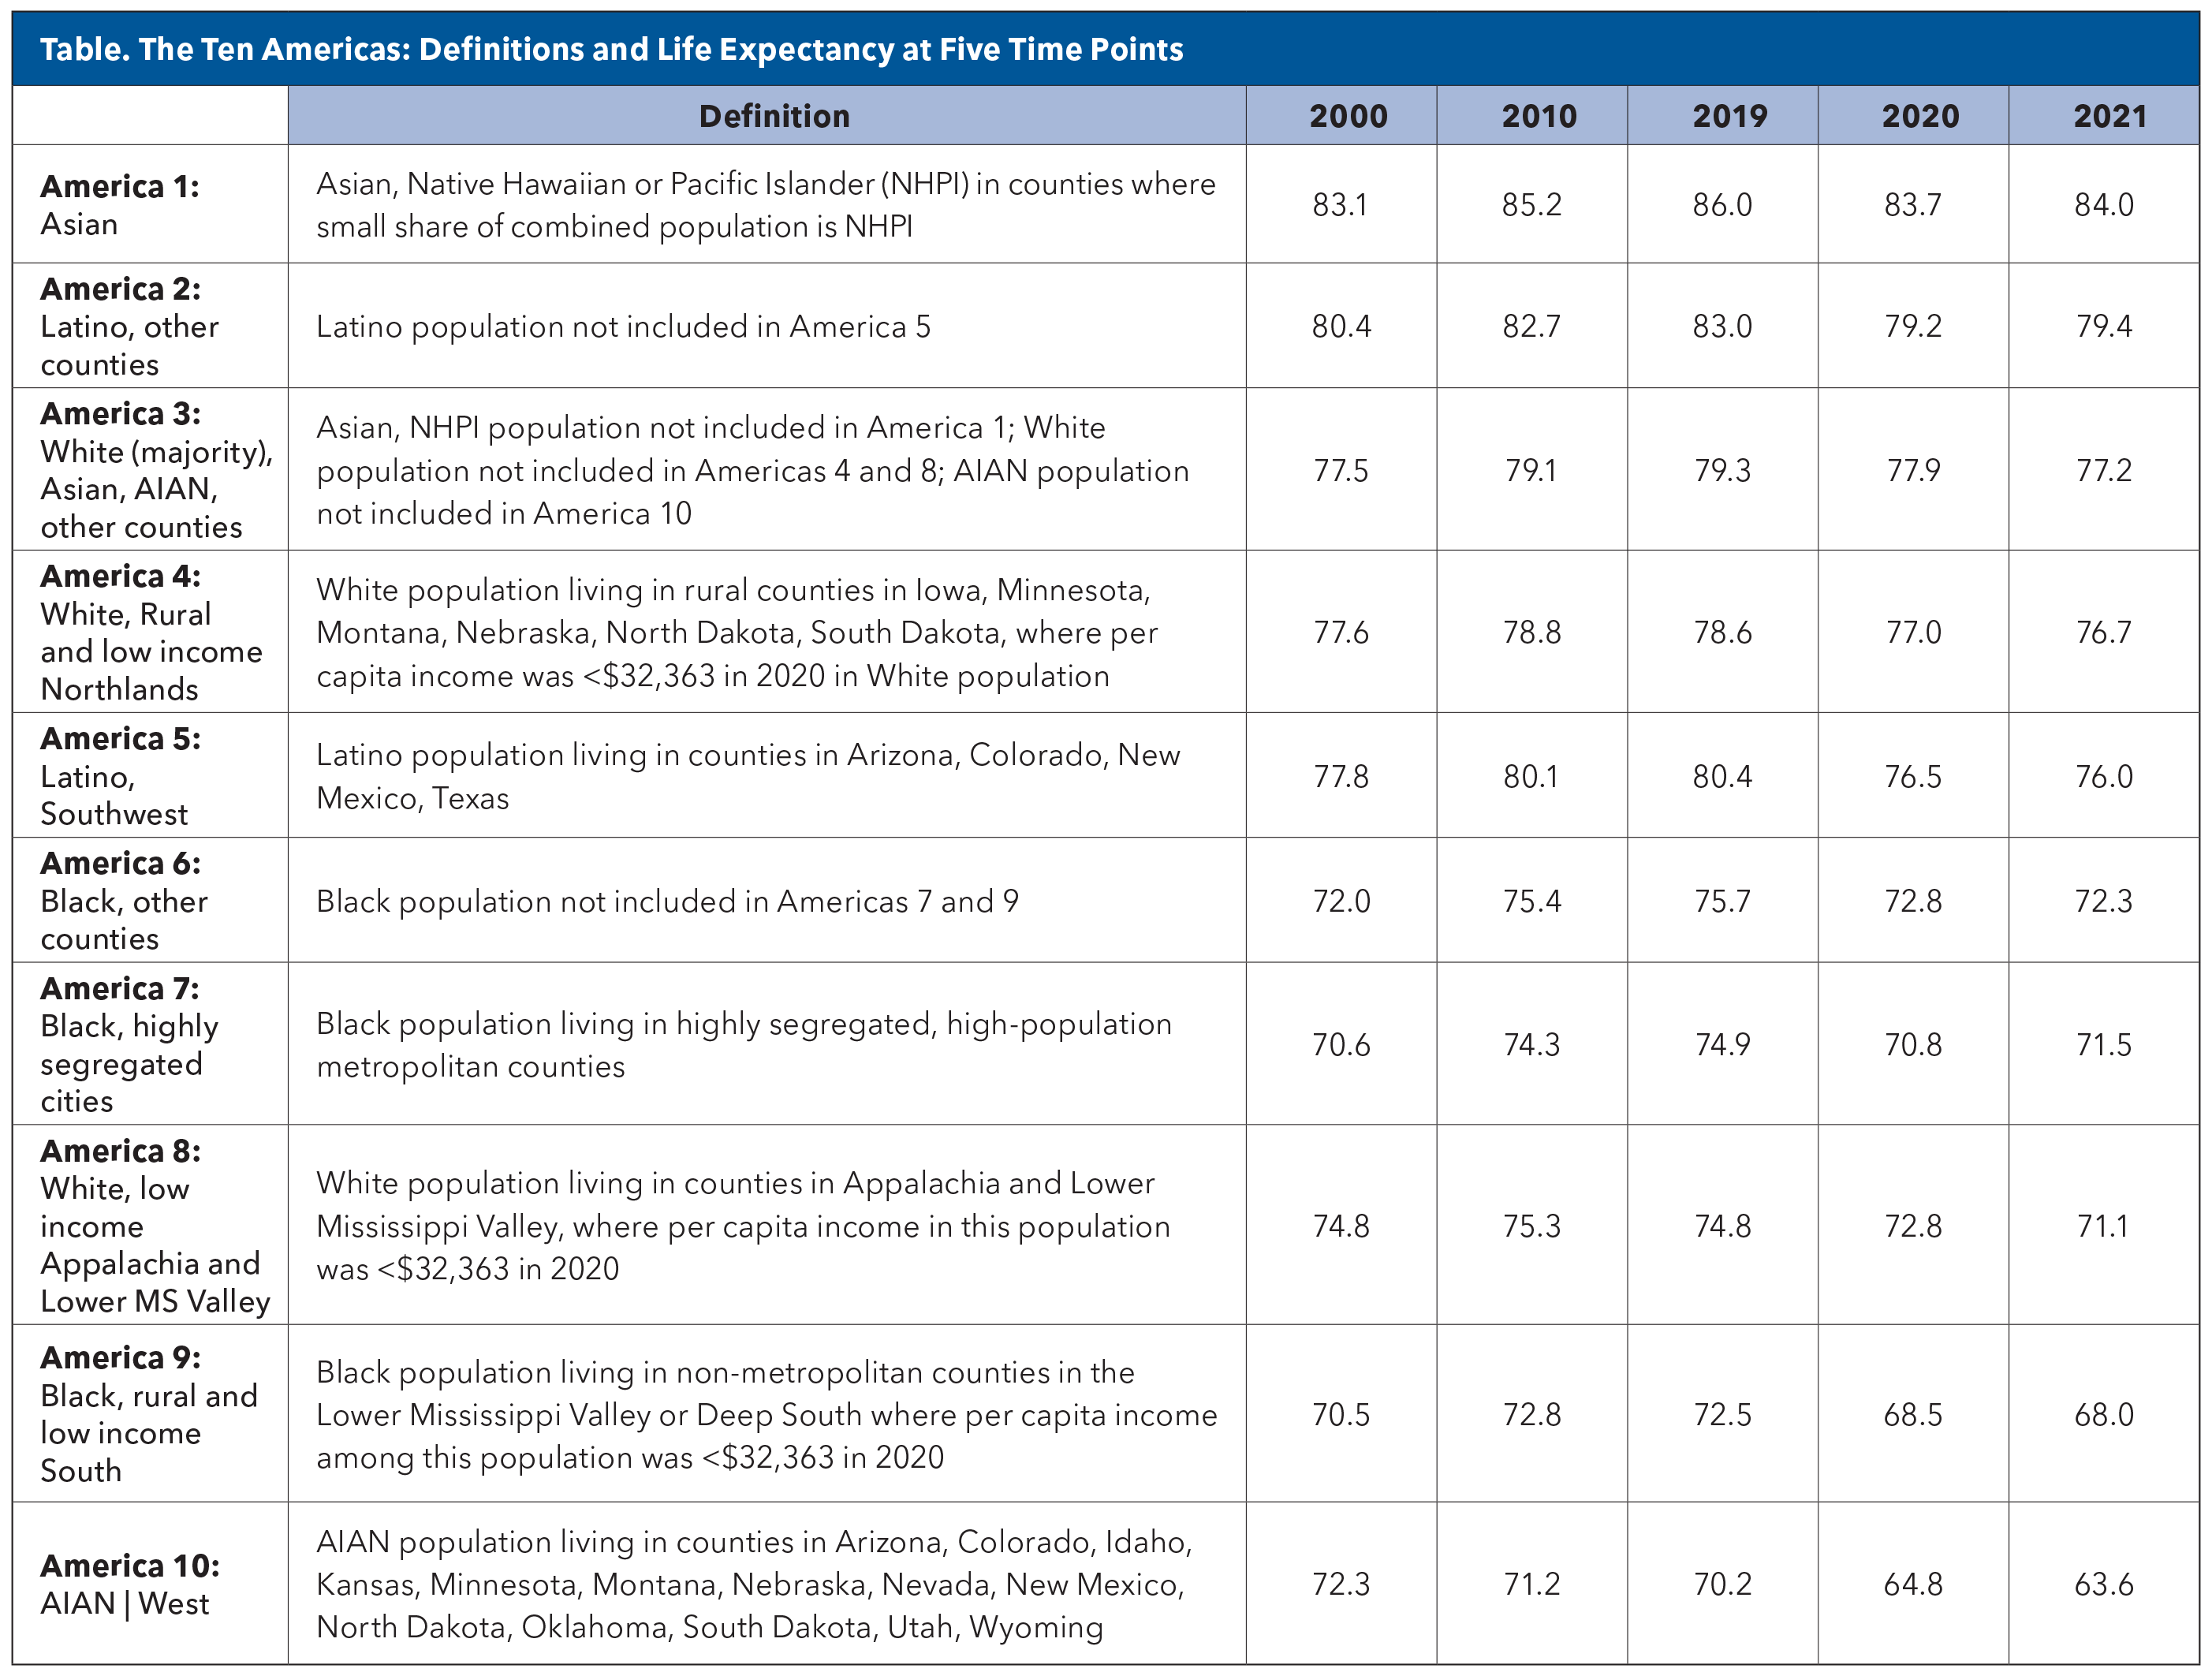
The systematic analysis published in The Lancet was conducted by Laura Dwyer-Lindgren, PhD, and colleagues at the IHME and partitioned the U.S. population into ten mutually exclusive groups ("Americas" 1 to 10) defined by race, ethnicity, geography, metropolitan status, income and Black-White residential segregation.
The researchers assessed life expectancy trends between 2000 and 2021. Death and population data were obtained from national registries, adjusted for misclassification of race/ethnicity, and analyzed through abridged life tables.
Already Stark Differences Widened Further
In 2021, Asian Americans living in counties with predominantly Asian populations had the highest life expectancy at 84.0 years (peaking at 86 years in 2019 before declining to 83.7 in 2021), while American Indian and Alaska Native individuals in Western states had the lowest at 63.6 years (down from 72.3 years in 2000).
All three categories of Blacks (Americas 6, 7 and 9) saw improvements in life expectancy before 2020 but faced substantial declines during the pandemic, while Latino groups (2 and 5) had relatively high life expectancy but also saw significant pandemic-related declines.
The data indicated an alarming health crisis for American Indian and Alaska Native (AIAN) people living in the West. This population (America 10) was the only group to experience a drop in life expectancy between 2000 and 2010 and again between 2010 and 2019 – falling from the already low 72.3 years in 2000 (vs. 83.1 for America 1) to 70.2 years in 2019 (vs. 86 years for America 1). COVID-19 set them even further behind the other Americas, with a 6.6-year drop in life expectancy between 2019 and 2021.
The Ten Americas study updates and expands on the original Eight Americas study, published in 2006.2 The earlier study found gaps in life expectancy in 2001 across different populations of more than a decade (12.8 years for females and 15.4 years for males). Ten Americas was funded by the State of Washington, Bloomberg Philanthropies, and the Bill & Melinda Gates Foundation.
Key additions to the Ten Americas study include groups for the U.S. Latino population. The Eight Americas study did not consider Latino ethnicity, so Latinos were grouped into one of the Americas based on their race; most Latino Americans self-report as White (92.7%).
Black Americans Gain, Then Lose Over Past Two Decades
In 2000, Black Americans living in rural, low-income counties in the South (America 9) and Black Americans living in highly segregated cities (America 7) had the lowest life expectancy (around 70.5 years for both populations).
Between 2000 and 2010, life expectancy increased for every America except for AIAN people living in the West (America 10). During this time, the three Black Americas (6, 7 and 9) showed some of the largest gains in life expectancy, increasing by as much as 3.7 years, with Black Americans living in other areas (America 6) exceeding the life expectancy of White Americans living in low-income counties in Appalachia and the lower Mississippi Valley (America 8) from 2010 onwards, except in 2020.
"The gap between life expectancy at birth for Black and White Americans may never have been narrower than it was in the mid-2010s," said co-author Thomas Bollyky from the Council on Foreign Relations, Washington, DC. "It's likely that long-term improvements in education available to Black children and young adults in recent decades, as well as reductions in homicide rates and deaths from HIV/AIDS – causes of death that have disproportionately impacted Black Americans – may have contributed to these noteworthy gains for Black Americans."
However, between 2010 and 2019, improvements in life expectancy at birth for the three Black Americas (Americas 6, 7 and 9), as well as for all other Americas, largely stalled. This trend may be attributed to an increase in drug overdose deaths and homicides, along with a slowdown in the decline of cardiovascular disease deaths, likely linked to rising obesity rates.
With the COVID-19 pandemic, things got even worse. All groups experienced drops in life expectancy, but those near the bottom of the list experienced greater declines. For example, while Black Americans living in highly segregated cities (America 7) and Black Americans living in rural, low-income counties in the South (America 9) were expected to live an average of 74.9 years and 72.5 years, respectively, in 2019, this fell by approximately 4.0 years in 2020. For White majority, Asian and AIAN groups living in other counties (America 3), the corresponding decline was only 1.4 years. By 2021, none of the Americas had recovered to their pre-COVID life expectancies.
How Does the U.S. Compare to Other Countries?
The U.S. ranks near the bottom of countries belonging to the Organization for Economic Co-operation and Development (OECD), placing 32nd out of 38 members, with a life expectancy of 76.4 years in 2021 – nearly four years below the OECD average of 80.3 years.3 Particularly striking is that the U.S. falls between Colombia (#31) and Poland (#33), countries with significantly lower GDP per capita and less developed health care systems.
The average life expectancy for countries considered comparable to the U.S. – namely, Australia, Austria, Belgium, Canada, France, Germany, Japan, the Netherlands, Sweden, Switzerland and the U.K, is 82.2 years.
"If you removed the bottom five 'Americas' from the equation – meaning all African Americans, a few relatively small groups of very rural, very poor White populations, and AIAN living in the West – U.S. life expectancy would still be well below the top performing OECD countries," says Paul L. Douglass, MD, MACC, chair of ACC's Health Equity Task Force. "But the U.S. would at least be closer to keeping pace with average life expectancy across other developed countries," he adds. Indeed, America 8 and America 10 represent just 3.11% and 0.40%, respectively, of the total national population.
African Americans make up just over 13% of the U.S. population, clearly representing the largest of the populations dealing with such low life expectancy, notes Douglass. ""This is why, when we do the work of dealing with disparities, while all disparities are important to recognize and alleviate, we tend to focus so much on African Americans."
Drivers of Disparity
Disparities in income and education partly explained life expectancy differences. For example, Black Americans living in rural, low-income counties in the South (America 9) and AIAN individuals living in the West (America 10) had the lowest income per capita and percentage graduating college as well as the lowest life expectancy in most years between 2000 and 2021.
However, the authors note some unexpected disparities, which indicate that other factors beyond income and education are contributing to differences in longevity. For example, White (the majority), Asian and AIAN people living in other counties (America 3) had the highest income in most years, as well as the highest proportion graduating high school and the second highest percentage of college graduates. Despite this, America 3 was ranked only fourth or fifth in life expectancy before 2020 and in 2021 had a life expectancy almost seven years below that of the top performing America 1 (77.2 years vs. 84.0 years). As well, Latino groups outperformed expectations given their socioeconomic standing.
"I think this analysis helps to underline the notion that, while some groups clearly shoulder a disproportionate burden of disparities and excess mortality, we see that nobody is left unscathed," says Douglass. "Our health care delivery system and our insurance industry are difficult to navigate, and that really undermines the whole system such that access to care is fragmented and it is not patient centered. We all suffer from this, but all this complexity is most burdensome on those who are most vulnerable," notes Douglass.
Dwyer-Lindgren, et al., point out that fixed definitions may oversimplify complex dynamics across the Ten Americas and that grouping of the U.S. population based on county, race and ethnicity is just one way to understand the large inequalities in life expectancy. They also note that reliance on death certificate data, with adjustments for racial/ethnic misclassification, could introduce bias.
Writing in an accompanying editorial comment, Steven H. Woolf, MD, MPH, from the Virginia Commonwealth University Department of Family Medicine (Richmond) says that while the approach of disaggregating life expectancy results, for example by distinguishing between the life expectancies of the majority of White Americans and those of White Americans in low-income countries in Appalachia and the lower Mississippi Valley, is perhaps "not grounded in a theoretical model or conceptual rationale," this novel approach goes far in "unearthing findings that overall population statistics would otherwise obscure."
He concludes: "Understanding the root causes of disparate mortality rates ad meaningful efforts to address the social and environmental determinants of health are essential to close the gap."

ACC Goes All In On Health Equity
Despite groundbreaking advancements in cardiovascular medicine that have transformed lives, not everyone is reaping the benefits. These gaps are more than statistics. They are a stark reminder that the promise of modern medicine remains unfulfilled for too many.
Recognizing this, the ACC is deeply committed to advancing health equity and reducing disparities in cardiovascular care through a comprehensive strategy encompassing advocacy, education, research and community engagement.
Says Melvin R. Echols, MD, FACC, the ACC's Chief Diversity, Equity and Inclusion (DEI) Officer, "One of the things that is wonderful about America is that there is that dream out there to come and live your dream and be free to be who you are, but we also have to recognize that, with that, there is a culture of disparity in America that impacts multiple facets of cardiovascular care. This is leaving a large part of the population out of that dream because of early cardiovascular morbidity and premature death."
The ACC, leveraging its scientific expertise, has made health equity a core goal, reflected in its Health Equity Task Force, established in 2020 and set to become a standing committee this year, and comprehensive DEI strategic framework. The call to action is clear: achieving health equity is not just a goal but a moral imperative for the medical community.
"The College has acknowledged that much of the adverse outcomes seen in people who are most vulnerable revolve around cardiovascular care. Thus, it is incumbent upon the College as the leading cardiovascular society to assume some responsibility for helping to solve that problem," says Douglass.
The Task Force has developed an action plan that focuses on six domains and outlines a blueprint for implementing health equity and highlights future work necessary to achieve health equity (Figure). Through these programs, the College is demonstrating its dedication to fostering a culture of health equity, striving to ensure that every individual can achieve optimal cardiovascular health regardless of their background or circumstances.
In his multifaceted role to improve DEI, Echols takes a "rising tide lifts all boats" approach to health equity: "Every single lived experience is important and valid. We have to learn that moving equity is about moving together as a people and making sure we're doing the right thing for every patient without labels. It's not doing more for someone at a cost to someone else."
This article was authored by Debra L. Beck, MSc.
References
- Dwyer-Lindgren L, Baumann MM, Li Z, et al. Ten Americas: A Systematic Analysis Of Life Expectancy Disparities in the USA. Lancet Lond Engl. 2024;404:2299-2313.
- Murray CJL, Kulkarni SC, Michaud C, et al. Eight Americas: Investigating Mortality Disparities Across Races, Counties, and Race-Counties in the United States. PLoS Med. 2006;3:e260.
- Life expectancy at birth. OECD. Accessed Jan. 13, 2025. Available here.
Clinical Topics: Cardiovascular Care Team
Keywords: Cardiology Magazine, ACC Publications, Health Services Accessibility, Social Determinants of Health, Social Segregation